Research
I’ve come to the frightening conclusion that I am the decisive element in the classroom. It is my personal approach that creates the climate. It is my daily mood that makes the weather. As a teacher I possess a tremendous power to make a child’s life miserable or joyous. I can be a tool of torture or an instrument of inspiration.
Overview
- Introduction
- Cautions
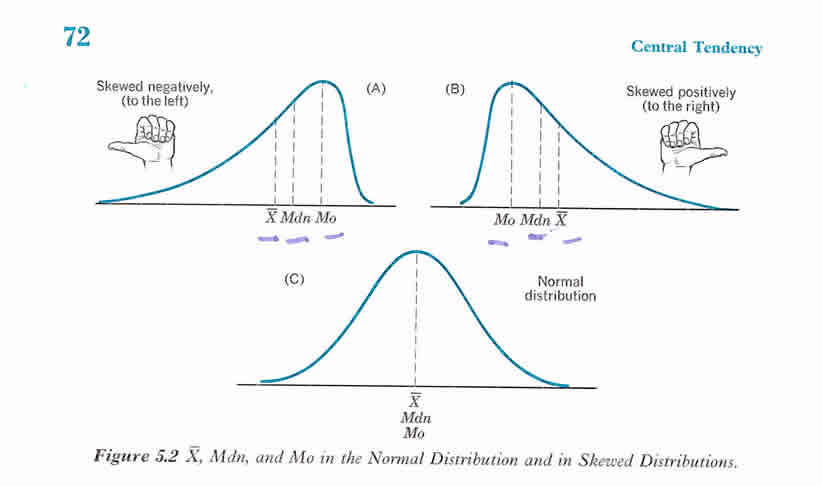
- Normal curves
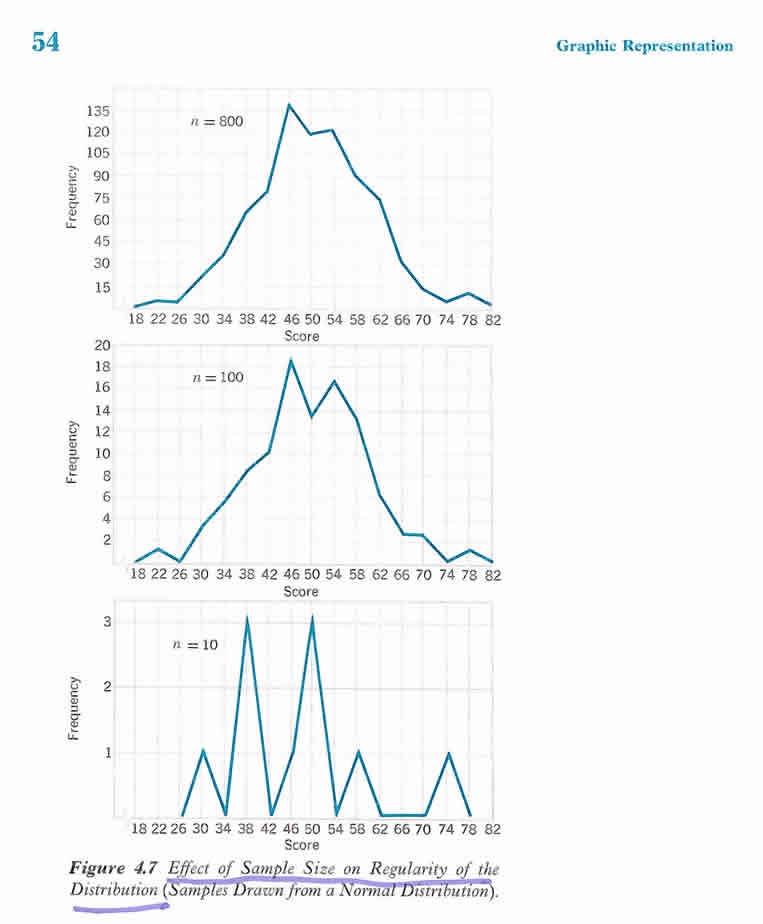
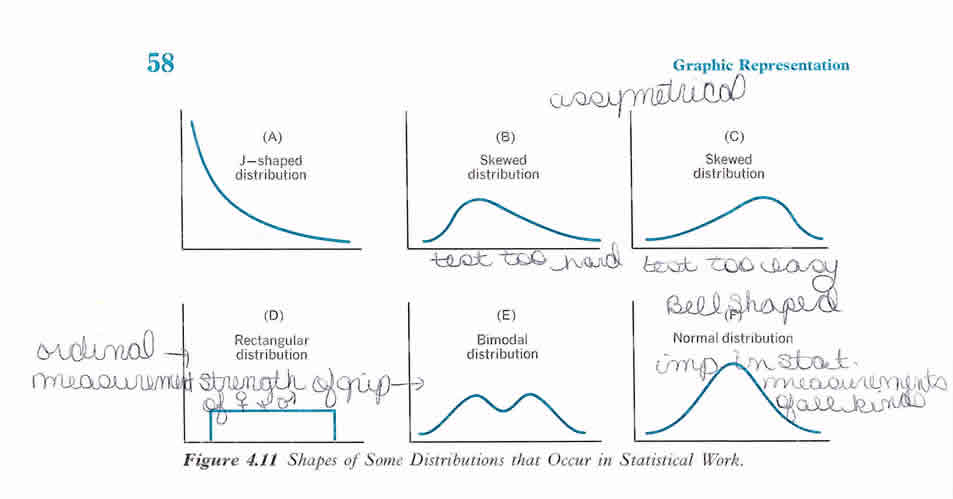
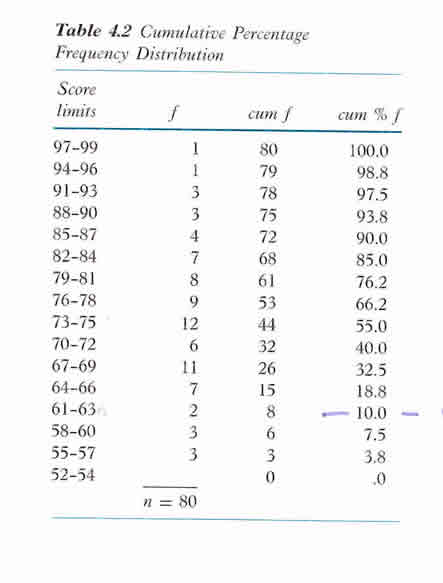
- Frequency distributions
Introduction
This page includes notes related to educational research and statistics.
Cautions related to assessment
Research in general
- Research summaries often undercut the power of their own research by tacking extensive cautions that undermine a reader’s determination of a clear conclusion.
- Putting too much reliability on randomized control trials (RCT) as the gold standard of research and not considering the possibility of the effects of different contexts in which the studies were conducted. How similar are the two groups before being randomly assigned, were there unexpected events that influenced one group and not the other.
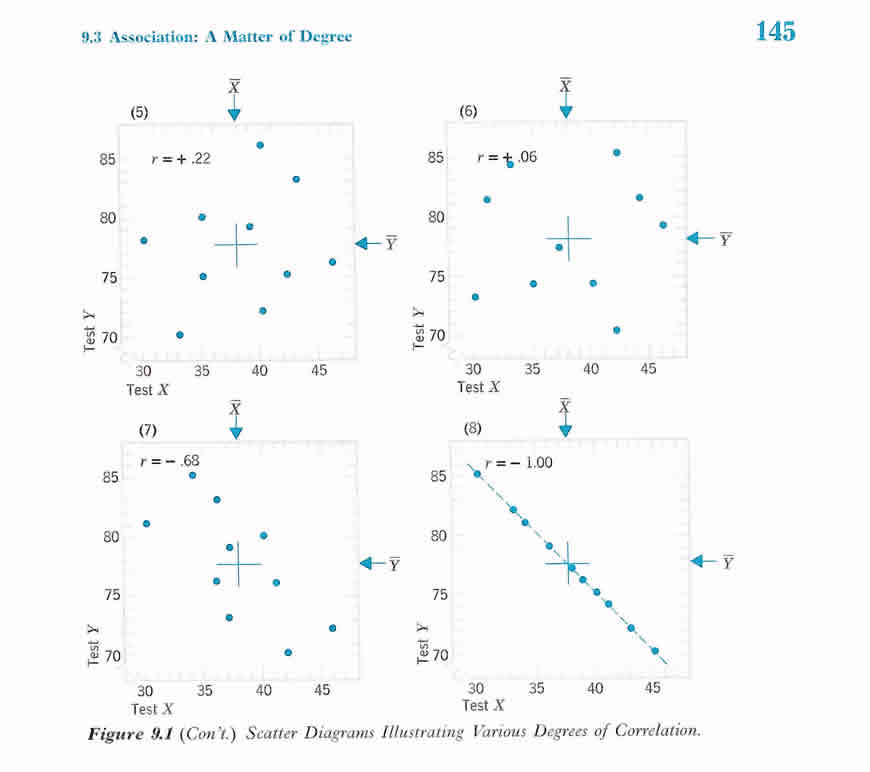
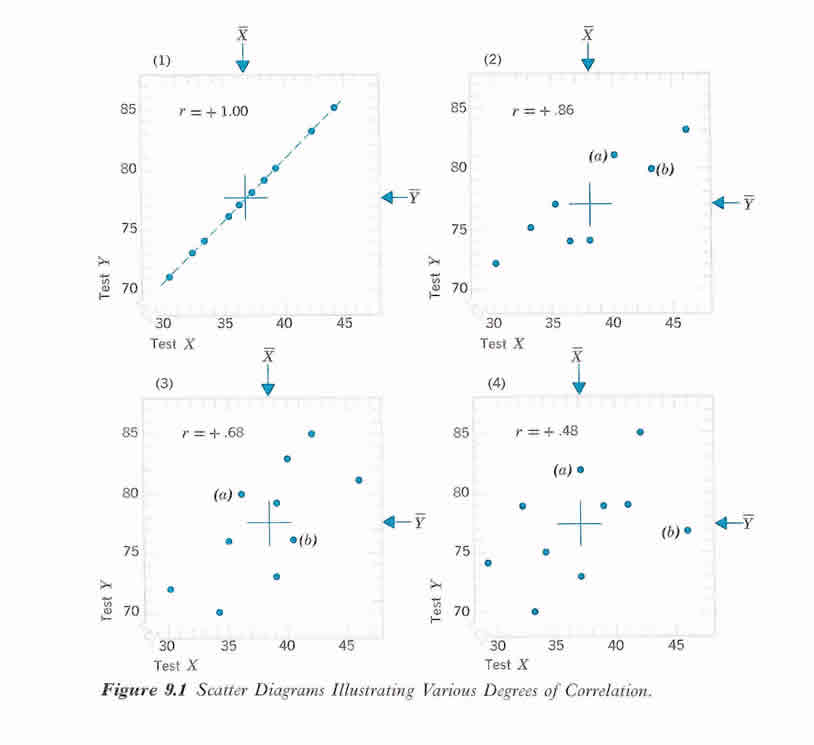
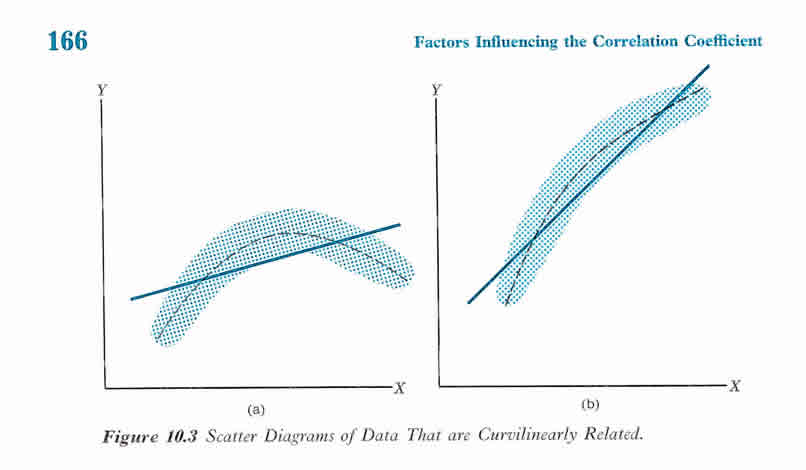
- Correlation studies do not suggest the intervention caused the outcome. The data don’t tell why the variables are associated with each other.
- Quasi-experimental studies - people use previously collected data to look for significant differences. Thus, making it hard to determine exactly how to compare variables and the differences between the edges of variables, and if variables are similar enough to each other from study to study. And if there were other variables, which influenced the outcomes.
- Statistically significant or p-value. A p value of .02 means there is a 5% likelihood the observed results were a stroke of luck. Or 95% likelihood the intervention was responsible for the results. The larger the sample size the more accurate it is expected to be like the larger population. The acceptability of what is used as statistical significance should be determined by the situation of use.
Educational research
- Not knowing the power of an effect size (which describes the intervention impact on learning) changes as learners get older. For example. An effect size of .20 wouldn’t be as powerful for preschoolers, but would for high school students. (Sample effect sizes for nationally normed test: K - 1.52, 1 - .97, 4 - .40, 6 - .23, 9 - .19, 12 - .06) That as learners progress from grade to grade or grow, their gains or effect size will be smaller and smaller.
Questions to ask when evaluating educational research:
- What’s the effect size?
- What’s the grade level?
- What kind f study?
- What’s the p-value?
- How cost effective is it?
Effect size
Effect size - are often expressed as standard deviations .2 means 20% of a standard deviation
add calculation examples
Cost-effectiveness
Cost-effectiveness can be determined by combining effect size or impact of the intervention with the cost per student of the intervention. Suppose the following values:
- Intervention effect .35 ES; cost per student $1,6000; or .35/16000 * 1000 = .21875
Compare with
- Intervention effect .20 ES; cost per student $270; or .20/270 * 1000 = .74074074
When comparing these two. The ES of .35 is more effective than .20ES. However, .22 is less cost effective than .74
Maybe an example of tutoring or use of computer assisted instruction to improve test scores.
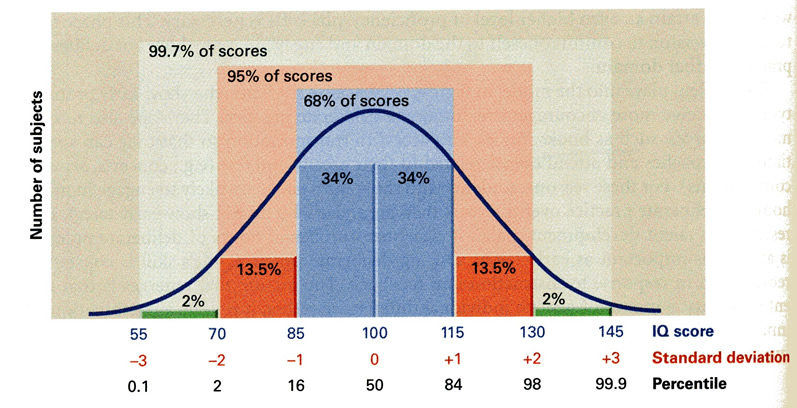
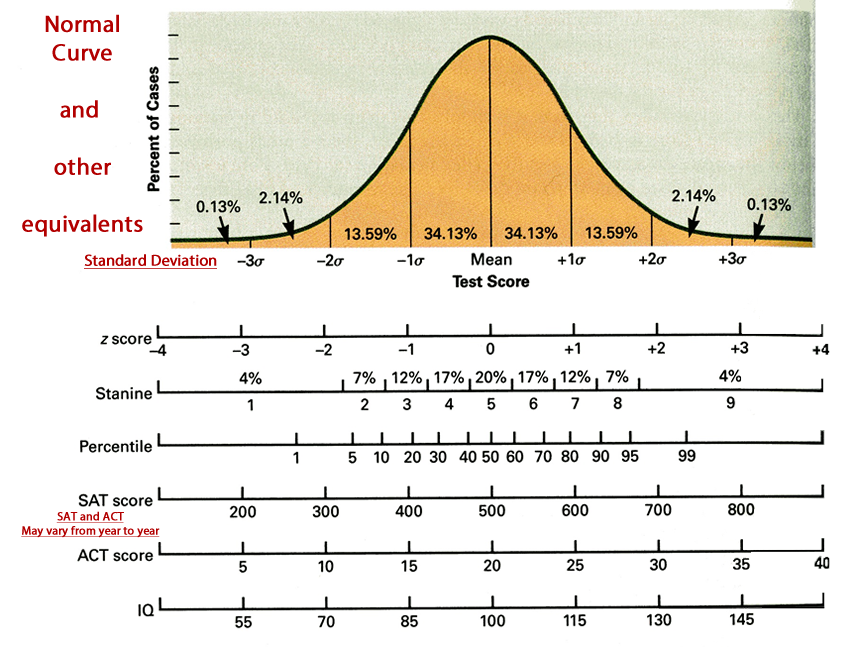
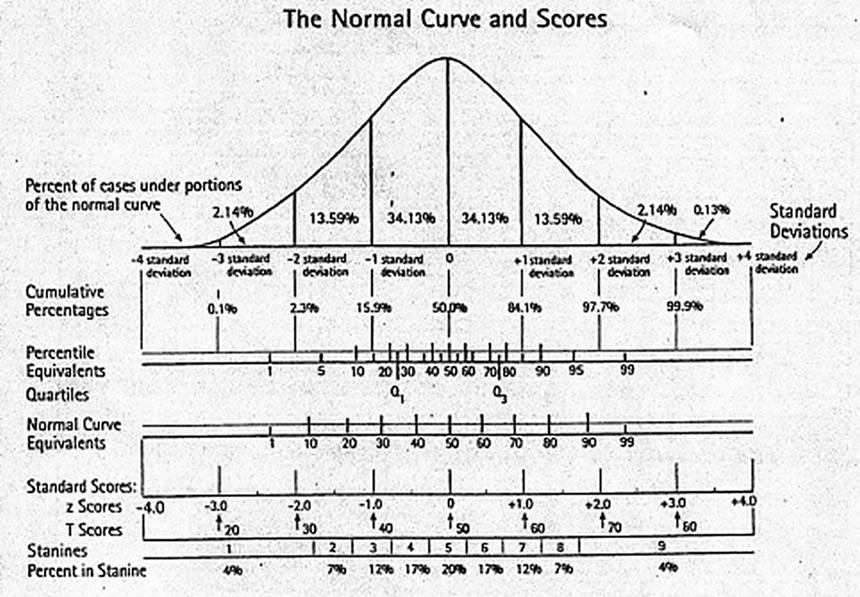
Normal curves,
With representations for:
standard deviation, z scores, stanines, percentiles, SAT scores, ACT scores, & IQ
IQ scores | standard deviation | percentile
Normal curve | standard deviation | z scores | stanines | percentiles | SAT | ACT | IQ |
Normal curve | cummulative percentages | quartiles | percent in stanines |
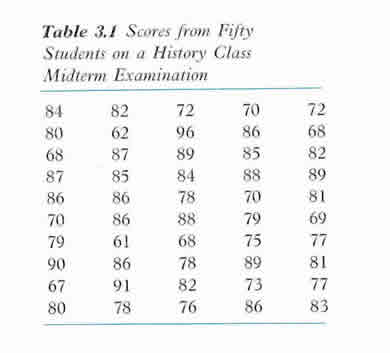
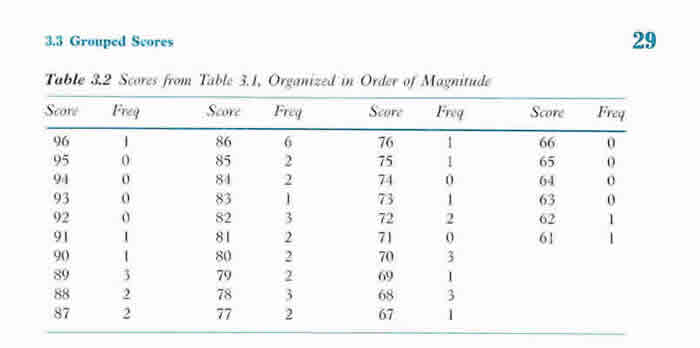
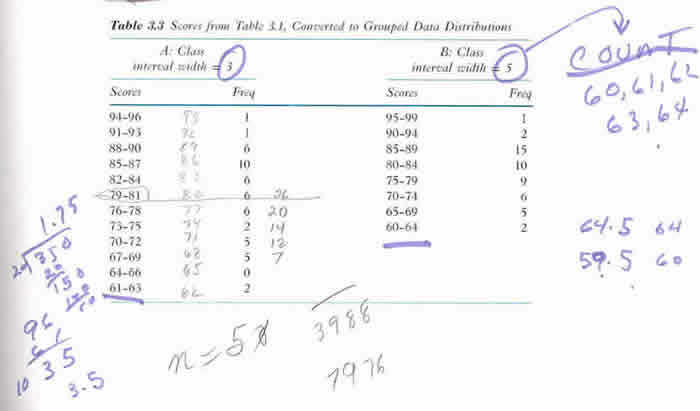
Frequency distribution examples with charts and graphs; Central tendency; Percentiles; and Correlations
History Midterm for fifty students - scores and frequency distributions
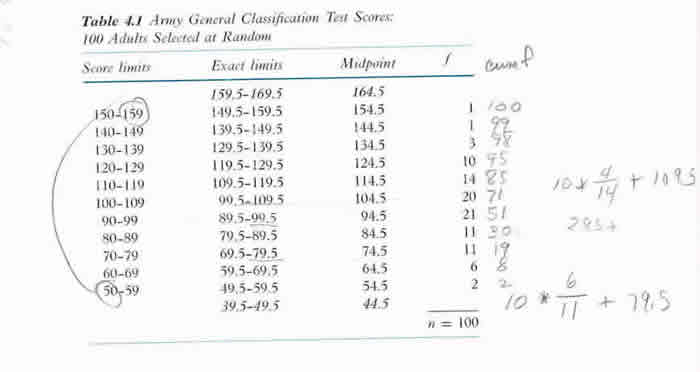
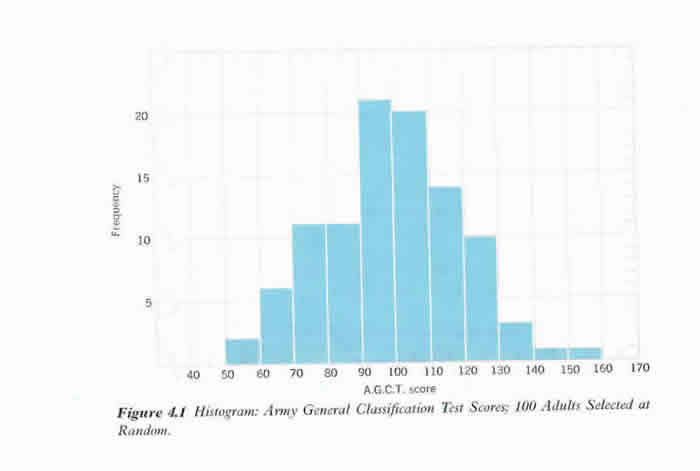
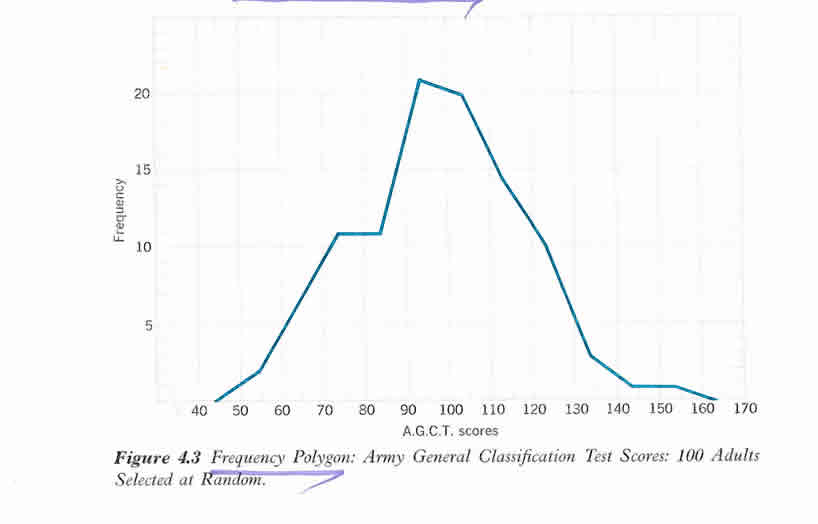
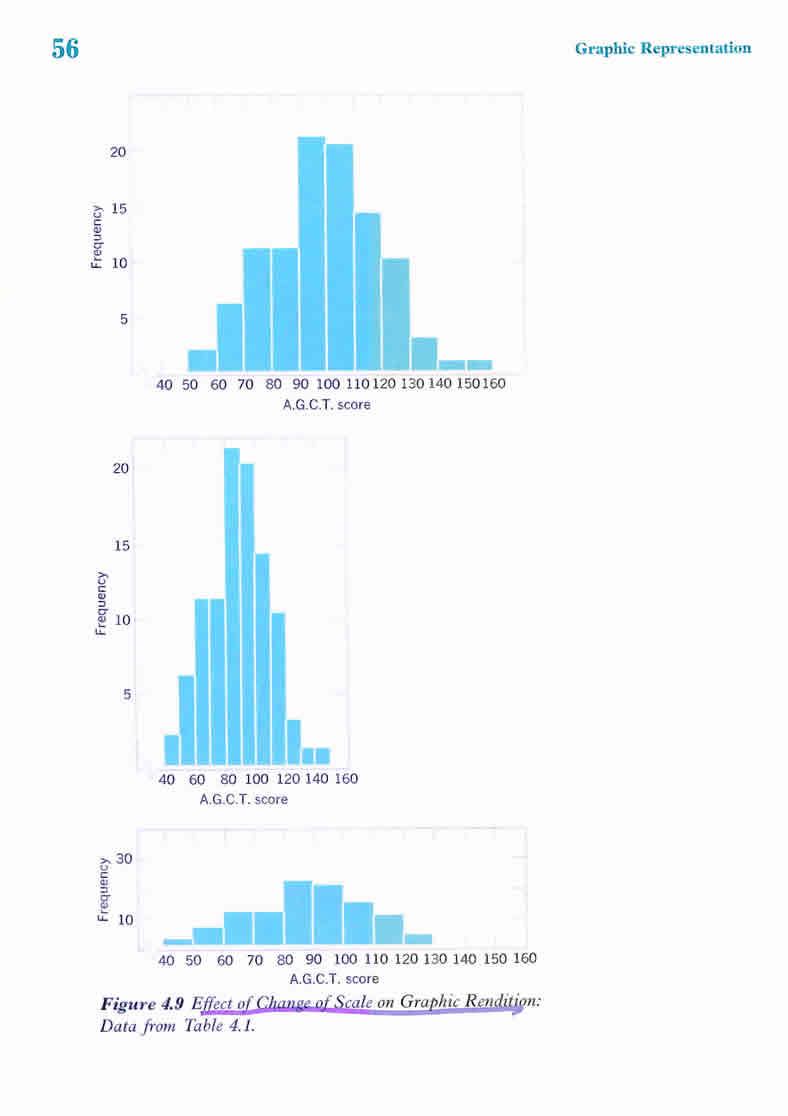
Army General Test Scores of 100 adults selected randomly
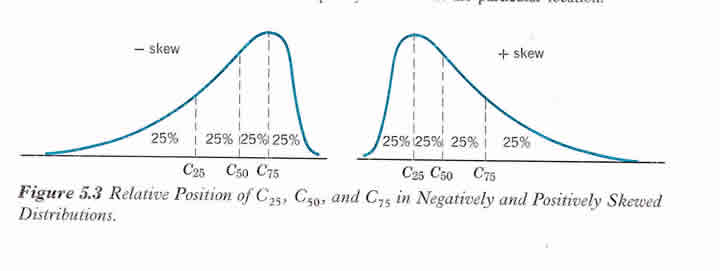
Distribution for Percentage and Percentile Rank example
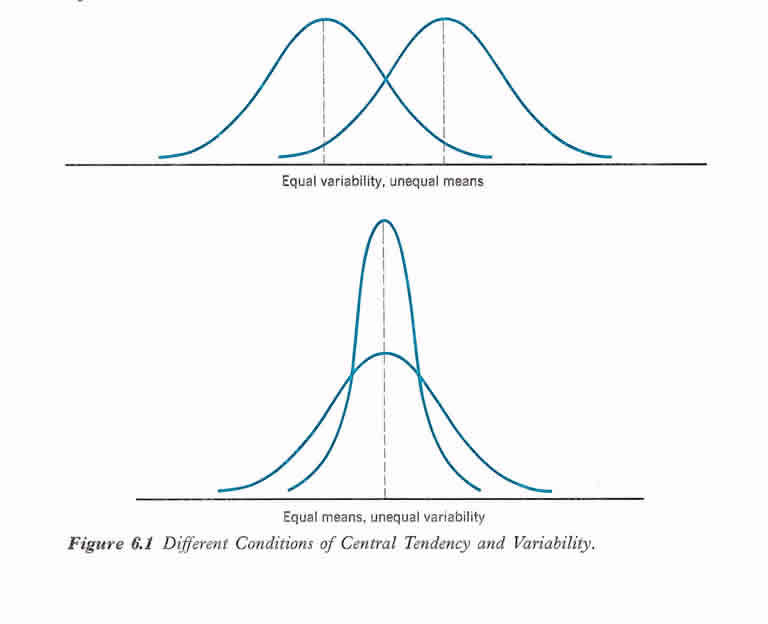
Central Tendency
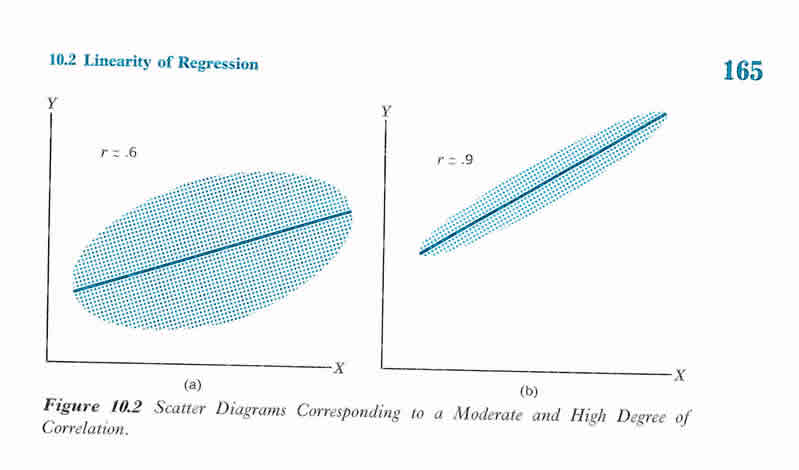
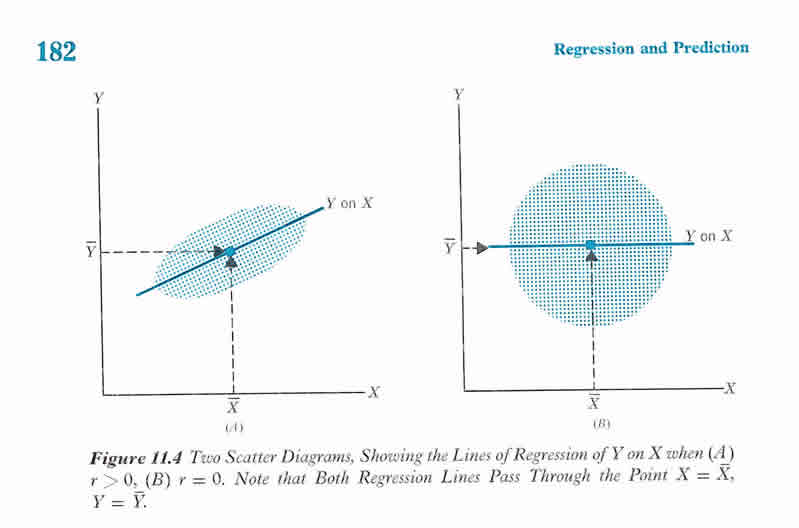
Correlation