Growth exploration and investigation activities
Page Overview:
Overview
Activities include ideas related to growth
- Mathematics: patterns, algebra, representation, charts, graphs, geometry, patterns, problem solving, reasoning, visual representation,
- Science. change, patterns, growth, life science, plants, animals
Growth is the process of growing in size.
Concepts and outcomes
Mathematical
Concepts
- Growth generally follows a pattern.
- Rate of growth varies.
- Growth can be represented with words, pictures, tables, diagrams, charts, graphs, equations, formulas, models, simulations, animations, video,
- Recursive formula for growth is a formula that uses a current measurement and adds to it a constant: next shape = current + growth constant.
- Direct formula for growth is a formula that uses a growth amount and multiplies it by a time period: next shape = current shape + (growth amount * number of time periods).
- Formula is an equation that states a rule about a relationship.
- Recursion uses a current value to find the next value.
- A quadratic formula is expressed as y = ax2 + c. With a and c constants. The largest exponent is two. Its graphic representation is convex or concave shaped. a is the slope and c the y intercept. Area kind of growth.
- A cubic formula is expressed as y = ax3 + c. With a and c constants. The largest exponent is three. Its graphic representation is convex or concave shaped. a is the slope and c the y intercept. Volume kind of growth.
- Exponential functions can be described as recursive (next = current * constant) and with a direct formula (y = acx; a is the start, c is the growth factor, & x is the time frame).
Mathematical concepts, misconception, and outcome knowledge base
- Data analysis
- Patterns & algebra
- Patterns
Outcomes
- Describe growth patterns.
- Represent growth in pictures, tables, diagrams, charts, graphs, …
- Interpret growth in pictures, tables, diagrams, charts, graphs, direct & recursive formulas for linear and exponential growth.
- Understand direct and recursive formulas.
- Understand the relationship between a formula and its graphic representation.
- Understand similarities and differences of linear, quadratic, cubic , and exponential formulas and growth.
- Model growth accurately with pictures, graphs, equations, and simulations.
- Recognize mathematical models, equations, and simulations don’t perfectly fit growth patterns.
Problem solving & inquiry
Pedagogical ideas
Activities
Focus questions
- What is a growth?
- What objects, events, or systems grow?
- What are different types of growth?
- What properties indicate growth?
- Identify different ways to measure growth?
- Do you grow at the same rate every day?
- Is there ever a time when your growth rate is or will be constant?
Related resources
- Graphing fact sheet
- Living & nonliving - Beginning plan to explore what is living and non living and the functions of living organisms.
- Gerbils - eight activity plans for a classroom pet (gerbil) with concepts and outcomes threaded to science standards.
- Soil & plant growth plans for upper primary & middle levels
- Tree rings primary grades
- Trees rings middle grades - tree rings, characteristics of trees, & environmental effects middle grade plan
- One variable activities to chart & find distributions, mean, median, mode, & graph
Activities
Grow plants from seeds
Young children can grow their own plants (plant back up plants to use as substitutes if necessary) Number of plants and type of data to collect should vary depending on the age of the learner. This activity is designed for middle level students and variables and numbers of plants can be increased or decreased for different ages.
Select seeds
 Wisconsin fast plants are great to grow from seed to seed and collect growth data. Grass seed and pea seeds are easy to grow, but take much longer to flower and seed.
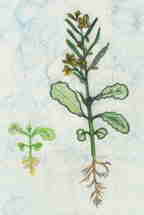
Peas plants are good to use to focus on germination and observe the development of different parts (seed coat, cotyledons, embryo (root, stem, leaf))) and investigate how the different parts develop and which parts develop separately or in combination. They are also prone to disease so a drop or two of Clorox to a liter of water when watering them is recommended.
Investigations
Select variables to investigate:
The procedure is based on two collections of data from at least six plants in two different types of soil. This could represent a class of 24 learners in pairs with six pairs collecting data of six seeds - plants in soil without fertilizer and six pairs collecting data of six seeds - plants in soil with fertilizer added. (Can plant a back up set in case some fail to germinate.)
- Soil - What is it about dirt that makes it good for seed growth? ... soil, compaction, silt, sand, clay, humus, nutrients (fertilizer) to germinate and grow plants? see also Soil & plant growth plans for upper primary & middle levels
- Light - Dark (closet with black construction paper caps, medium room with normal illumination, bright near grow light or other bright light source. Can use timers to regulate duration of light and dark.
- Water - Vary the amount. One way is to water with the same amount over different periods of time. Daily, every other day, every three days, once a week. Amount in ml will vary according to type of plants. Another way is to use the moisture level of the soil at different depths. Another is to water from the bottom of the container and place the plant and container into another container of water for different amounts of time (5 min, 10 min, 20 min, 40 min). The amount of water absorbed can be determined, recorded, and charted. It is also possible to use a combination of methods and record the total amounts of water applied to each.
Growth - the most obvious way to measure growth is height. However, observation of plant grown in different levels of light will show plants grown in low light will grow tall and spindly. Plants grown in more optimal light will not be as tall, but they will be more bushy, lush, or healthy. It is good for learners observe this and discover height alone may not be a good variable to determine the health of a plant. For more experienced learners the height and diameter (canopy size) can both be used and for more mathematically inclined learners a ratio of the two could be calculated.
Representing the collect data - Measurements of change (responding variables), height, width (canopy), leaf size, root spread, … for different manipulated variables can be represented with notes, diagrams, charts, and graphs. All of which can be created for individual plants over time or collections of plants over time. Each group or learner can collect and represent data for the seeds and plants they are responsible for and all the groups data can be represented on class charts and graphs. A class chart or graph can be made on large sheets of paper with small adhesive polka-dots and if appropriate lines drawn to represent a pattern. Or data can be entered into electronic spread sheet and graphing programs.
Procedure
This procedure is based on two investigations (growing plants in different soils one without fertilizer and one with fertilizer), which will yield two sets of data all grown under the same conditions (fast plant investigation) except fertilizer being added to one set.
Investigation data collected:
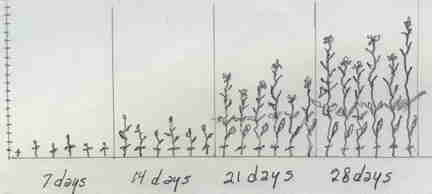
Collect data on the size of the plants at intervals of days for a total of about 20 days.
Plants in non fertilized soil. (data set A)
Plant Growth no fertilizer |
A | B | C | D | E | F |
|---|---|---|---|---|---|---|
| Start | ||||||
| Day | ||||||
| Day | ||||||
| Day | ||||||
| Day | ||||||
| Day | ||||||
| Day |
Plants in non fertilized soil. (data set B)
Plant Growth fertilized |
A | B | C | D | E | F |
|---|---|---|---|---|---|---|
| Start | ||||||
| Day | ||||||
| Day | ||||||
| Day | ||||||
| Day | ||||||
| Day | ||||||
| Day |
Representations for the data
- A chart to visually represent the height of one plant on each of the days measured. Sample class of 24 would have a class collection of 12 charts.
- A graph with a dot for the height of one plant for each of the days measured with a smooth line drawn as close to all the dots to form a smooth line, which will probably be curved. Sample class of 24 would have a class collection of 12 graphs.
Discussion questions
- Is there a typical plant that was grown in soil A?
- Is there a typical plant that was grown in soil B?
- How can you predict the growth of a plant in A at day 16?
- How can you predict the growth of a plant in B at day 16?
- How can you explain the range of plant growth for plants in A?
- How can you compare the growth of plants in A to B?
More representations
- Combine the data for all plants in data set A onto a scatter plot.
- Combine the data for all plants in data set B onto a scatter plot.
- Draw a smooth line that is closest to all dots.
Does the scatter plot representation help visualize a typical plant grown in those soils?
More representations and discussion
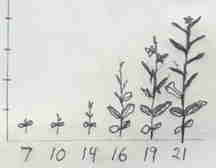
Select a data set and rank the plants from tallest to shortest on Day 7, 10, 13, 16, 19 , & 21
Plant Ranking |
Day 7 | Day 10 | Day 13 | Day 16 | Day 19 | Day 21 |
|---|---|---|---|---|---|---|
| Tallest | ||||||
| second | ||||||
| third | ||||||
| fourth | ||||||
| fifth | ||||||
| Shortest |
Plot the median height for plants in that data.
Draw a smooth line to represent the median height from day 7 to 21.
How does the line in the scatter plot compare to the line for the median heights?
Repeat the procedure for medians of the data sets and maybe modes.
Pick six plants from the same data set for four intervals and make a chart.
How does the chart compare with the scatter plot and graphs to represent the data?
Make a stem and leaf plot, compare it to the above, and explain the advantages and disadvantages of each. Maybe use a Stem-and-Leaf Plotter accesable on the internet to explore the sets of data for different investigations.
Graph the data of six plants
Use the Graphs: Data analysis, variables, relationships, and graphing fact sheet and make a chart or graph for one plant.
Use the Graphs: Data analysis, variables, relationships, and graphing fact sheet and make a chart or graph with all six plants on the same graph.
Answer the questions:
- How does the growth of two plants compare?
- When did the plants grow the fastest?
- Did they all grow at the same rate?
- Which plant was the shortest on day ___?
- Which plant was the tallest on day ___?
- Will the plants continue to grow?
- How did the plants grow from day to day?
Write a paragraph that compares the growth of six plants.
Model and simulating growth
Formulas, diagrams, flow charts, flip book, computer programs, stories, comic book, and animations can be used to describe growth. Computer technology can be used to model plant growth. Different software programs, Comic Life to make stories as comics, Flash, Logo, and more. Get creative.
At minimum learners should make a model to understand basic plant growth patterns: stem, leaf(leaves), stem, leaf(leaves), ... flower so they will be better prepared for the plant growth patterns in the next activity.
Or make them as detailed as desired.
Three general outlines for any technology.
Animation board for plant growth above ground
- Grow stem
- Grow leaf
- Grow stem
- Grow leaf
- Grow stem
- Grow flower
Flow chart simple
- Height = 0
- If height < 30, then
- draw stem
- draw leaf
- make height = height + 6
- Draw flower
Flow chart (hint at possible complexity to add)
Start
- Set time to start (zero)
- Increment time by growth interval
- Procedure germinate
- Check for germination
- If seed has met conditions for germination, then grow root and stem, else germinate.
- Grow root and stem
- Increment growth interval
- Repeat until either a certain height or number of growth intervals
- Grow root and stem a specific amount.
- Grow leaf branch on stem. Set leaf to leaf + 1.
- If leaf > 3, then grow flower. Set flower to yes.
- If flower fertilized, then mature flower to seed
- Fertilize flower?
- If bee visits, fertilize flower (could put random generator). Set flower fertilized to yes.
- End repeat
- Wait till end of season (number of growth intervals)
- Decompose
- End
Plant growth patterns
After modeling some growth patterns, review these simple growth patterns.
- stem, leaf, stem, leaf,... flower
- stem, 2 leaves, stem 2 leaves, ... flower
- stem, 3 leaves, stem 2 leaves, ... flower
Let's make some problems.
Suppose plants grow a stem and leaves each day. If the stem grows 8 mm a day, how tall will the plant be in 10 days if it is 10 mm at day zero?
Day |
0 | 1 | 2 | 3 | 4 | 5 | 6 | 7 | 8 | 9 | 10 |
|---|---|---|---|---|---|---|---|---|---|---|---|
| Plant height in mm |
Draw a graph for the data from day 0 - day 8.

What is the direct formula? height = ___ + ( __ * ___ )
This is a linear relationship.
From your experience, is this realistic?
One way to make the model more realistic is for the stem parts to get smaller as the plant grows. The table shows plant measurements and values determined with a model (formula).
Day |
1 | 2 | 3 | 4 | 5 |
|---|---|---|---|---|---|
| Measured plant height in mm | 20 | 30 | 35 | 38 | 39 |
| Calculated height in mm | 20 | 30 | 35 | 37.5 | 38.75 |
What is the formula used to calculate the height?
A formula that uses a current value to find the next is recursive.
Example
Growth = .8 * recent stem length
Use this idea and find the daily growth and heights.
Day |
0 | 1 | 2 | 3 | 4 | 5 | 6 | 7 | 8 | 9 | 10 |
|---|---|---|---|---|---|---|---|---|---|---|---|
| Plant height in mm | 40 | 72 | |||||||||
| Stem growth added to current height | 32 |
Graph the stem lengths
Graph the daily height
Linear?
What models could be used to explain the growth for these two plants.
Day |
1 | 2 | 3 | 4 | 5 | |
|---|---|---|---|---|---|---|
| Plant A height in mm | 64 | 112 | 148 | 175 | 195.25 | changing growth |
| Plant B height in mm | 40 | 80 | 120 | 160 | 200 | constant growth |
Formula for A (hint: recursive .75)
Formula for B (hint: direct 40)
In some ways the model is closer to actual plant growth, but if it is used to make many plants, then they will all be the same height. To have a model that will result in plants with different heights, chance can be added to a model. Example. Change values can be determined by using a random value determined with a spinner, die, or computer and used with other values.
Use areas of leaves to determine growth patterns.
Snails growth
Compare snail sizes to the amount of food they eat. What is the relationship of growth to size of snail and food intake. Compare length to food intake (linear). Length & width to food intake (quadratic). Length, width, height, to food intake (cubic, V= 2/5 l*w*h). Can you find the relationship of snails size and weight? Then use one to predict the other.
What is the difference between growth described by the quadratic equation (y= x2) and cubic equations (y=x3)
What about exponential growth?
Plant growth
A one meter square area is turned over and left fallow. The chart show the plant population in the area for 4 weeks
Week |
1 | 2 | 3 | 4 | 5 |
|---|---|---|---|---|---|
| Plants | 2 | 4 | 8 | 16 |
What is the growth formula?
What is the shape of a graph for it?
Expansion activities
- Use what you have learned to collect data for plants and animals that grow and see what formula best matches their growth.
- Create simulations to match growth data.
- Animate growth.