Watersheds: streams, rivers, floods, & stream tables to model the effects of slope & water volume on erosion & channeling
Earth science - middle grades
Last edited - June 1, 2026
- Introduction
- Background information
- Big ideas, concepts, facts, and outcomes
- Inquiry focus
- Activity sequence
- Resources and materials
- Focus questions
- Scoring guides
- Lessons and activities detail
- Assessment built into activities with Lab notes
- Lab notes
- Lab note 1 - Characteristics of water flow
- Lab note 2 - Steams with different shapes & volumes
- Lab note 3 - Streams with different flow rate, slopes
- Lab note 4 - Moving the streams into a bed
- Lab note 5 - No erosion?
- Lab note 6 - Volume & Speed in a Stream
- Lab note 7 - Streams Erosion, Transportation, & Deposition
- Lab note 8 - Movements of sand, erosion, & deposits
- Lab note 9 - Erosion deposition & meandering streams
- Lab note 10 - Expansion activities
- Lab note 11 - Floods & their effects on buildings, channels, & watersheds
- Lab note 12 - Zoo and flooding - design a zoo, flood, redesign, flood again
- River & stream picture album
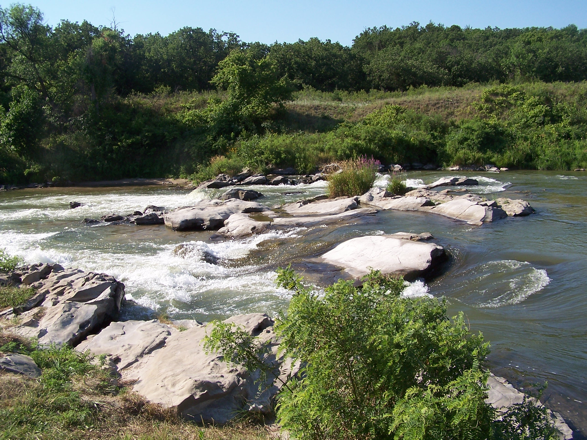
- Niobrara River, Nebraska July
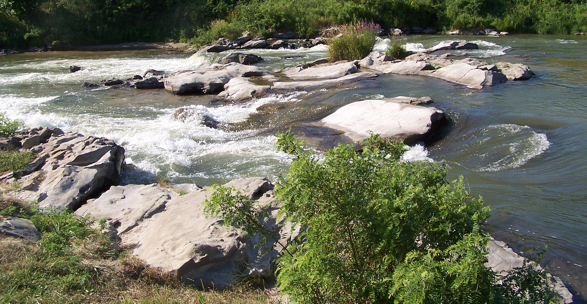
- Niobrara River Nebraska, July - closer
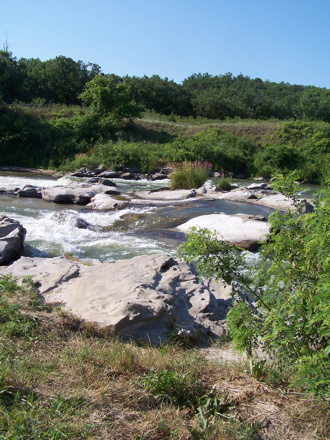
- Niobrara River Nebraska, July - closer yet
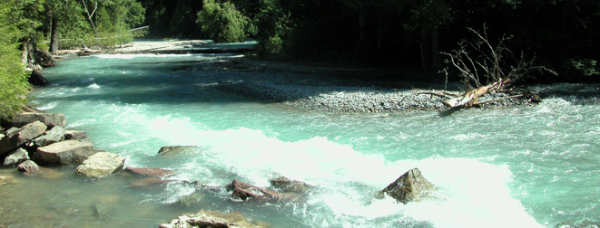
- Avalanche Creek Montana July
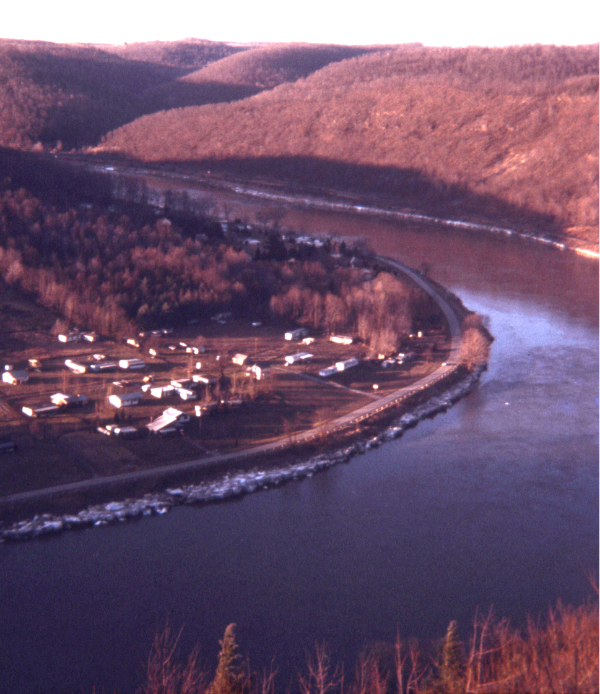
- River bend through the mountains 1971
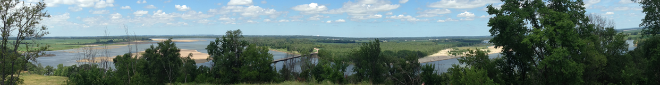
- Mulberry Bend, Missouri River - shot in Nebraska south of Vermilion SD
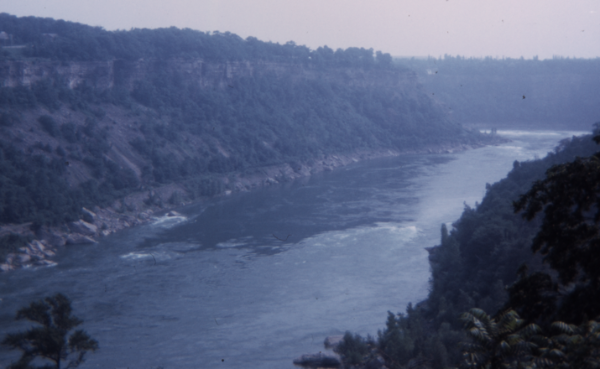
- Niagara river 1970
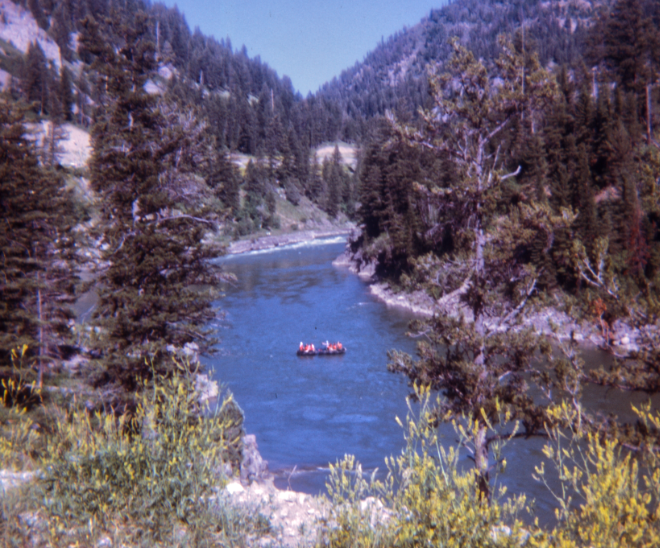
- Rocky Mountains river 1973
- Grand Canyon river valley 1978
- Monongahela River, Pittsburgh, PA 1972 flood
- High waters in Pittsburgh where three rivers meet!
- Erosion of a pile of dirt after one reain storm!!
- Dry Platte River 2023
- Expansion resources
- Eddies diagram from Leonardo da Vinci's notebook
- Irrigation & runoff in Benagal
- Managing sediment to protect tidal marshes
- Ground water & a water cycle model
- World Rivers
- Classification of stream and rivers for classification of land use and environmental protection
- Watersheds in North America
- Mississippi delta changes
- Watershed flows to the oceans
- Flash flood video - Texas 2025 July
Introduction
This unit explores watersheds: streams, rivers, erosion, flooding, and stream tables to model their changes and migration. It includes intended learnings, an activity sequence, lesson plan, scoring guides, supporting materials, resources, materials and lab notes for learners to record their obsevations and explanations. Everything ready to go!
Related activities
- Watersheds - includes watershed models
- Models
- Erosion
- Water themed unit
- Water cycle
- Weather
- Ecosystem - A unit or project with a sequence of activities & plans to develop a deeper understanding of the interdependence required to maintin healthy ecosystems.
Background information
Water leaves footprints.
Watersheds are where water collects and flows to the oceans creating channels whose shapes determine flood risks, erosion hazards, and ecosystem that sustain the lives of three billion people who inhabit them worldwide.
Streams and rivers are not just water. They include plants, human made structures, and Earth particles: sand, clay, soil, and more; which are suspended in the water and move with the current or sink to the bottom.
They can pile up as sediment or erode the river bed as they move, changing the flow of the water, forming eddies, and shape of the rivers, streams, and watersheds over time. This can create serious consequences for safety, erosion, production of energy and recreational opportunities; all of which affect the quality of life and health of organism who depend on stream, river, and watershed environments. Multibillion-dollar efforts are based on the knowledge of how water flows and its interactions in streams, rivers, and watershed and their interactions with the ecosystems in attempts to manage them to preserve, restore, and prevent their degradation.
This investigation explores different volumes of water flow and how it affects erosion and channeling of streams, rivers, and other objects in and along its path. While we often associate large rivers with flooding, about 70% of global floods originate from small and medium rivers where local downpours produce sudden flash floods that cause water to rise rapidly, which can flood and wash debris to create massive destruction.
By studying the flow of water and its interactions with objects in its path, we can learn how to protect ourselves, our homes, our communities, and the ecosystems through which it flows.
Objects to consider related to streams and rivers flow include: water, ice, rocks, sand, clay, organic materials, stream beds, stream banks, embankment reinforcement, bank protection, channelization, dredging, wetlands, watersheds, ponds, ditches, pits, river bays, inlets, farmland, sewage treatment plants, organisms within the watersheds, canals, dams, bridges, wells, springs, homes, parks, green spaces, building complexes, ecosystems, …
Learners will collect and organize observational information as it relates to flow and variables that affect it to create explanations and develop models for stream, rivers, and floods. See research on explanation of causes for channel changes and migration.
To motivate and focus the learner's attention on the different interactions the water has at it flows, you can share Leonardo's drawing of eddies around a pier and float small pieces of paper in a stream to better observe how water interacts in a stream with water and with different surfaces of objects it incounters.
The term meander originated from the ancient Greek Meander River (Greek, Μαίανδρος Maiandros; Latin, Maeander). It had a very twisted convoluted path across a flood plain before it flowed into the Aegean Sea.
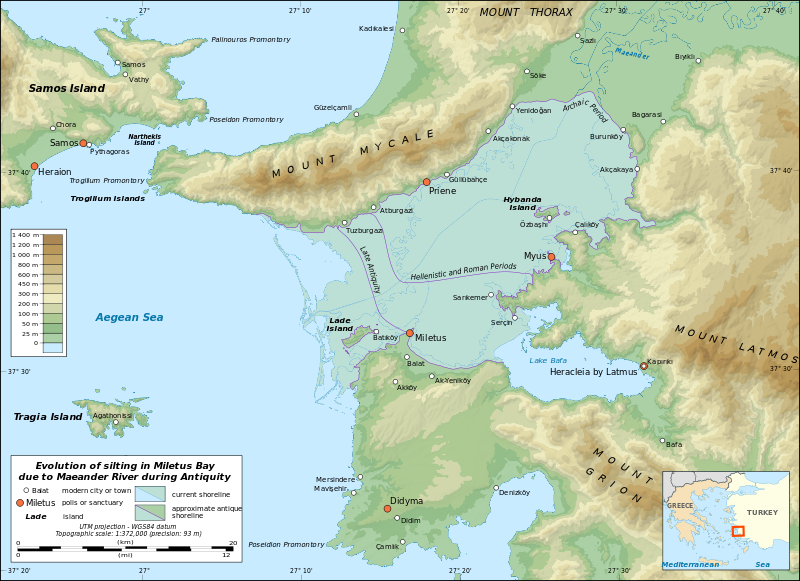 At the mouth of the Meander River the ancient Greeks built a seaport town that was considered the greatest Greek city in the east. Today, the town is called Milet, it is in Turkey and the Turkish name of the river is Büyük Menderes River.
Not only did the river meander, but it carried large amounts of silt, Which caused the river valley to silt up pushing the shore line farther into the Aegean Sea. The map shows how the shore line moved over time so the town became landlocked and today is miles from the shore. Source
Map source: Eric Gaba, Wikimedia Commons user [GFDL or CC BY-SA 3.0], via Wikimedia Commons
Meander has become a common noun used to describe anything convoluted and winding. For example, speech and ideas. E.g. His explanation meandered before arriving at a conclusion.
Sand is an important part of erosion, watersheds, streams, and coastal areas. Much sand is mined from coastal areas. This practice is unsustainable with present day practices. For more information see. The unsustainable harvest of coastal sands. In Science December 8, 2023. It includes a good overview on the use of sand and possible sustainable managment suggestions.
Vegetation is an important variable for a channel's migration.
Vegetation in river valleys slows floodplain erosion rates, reduces river channel widths, and drives a transition from braided, multichannel rivers to single-channel, meandering rivers. These changes also control carbon sequestration and other biogeochemical processes along river Channels. Hasson et al. report differences between floodplain vegetation, the plant life found in flat land adjacent to a river, or lack of vegetation controls river dynamics.
Meandering rivers in floodplains without vegetation tend to migrate downstream (parallel to the overall river flow direction), whereas meandering rivers with vegetated floodplains are likely to migrate outward across river valleys.
Source. Vegetation Steers a River's Path. Jim Pizzuto. Science August 28, 2025. Also Vegetation Changes the Trajectory of River Bends. Hasson et. al. Science. August 28, 2025.
More background information in Expansion resources
Intended learnings
Content Big ideas, concept & facts, & outcomes
Big ideas and specific outcomes:
The water cycle is an essential source of clean water, which is necessary for life on Earth. As water cycles through this cycle it interacts with Earth in ways that support life and destroy life. To survive, thrive, and enjoy our life on Earth it is important to understand watersheds, streams, rivers, and the hazards they present.
Concepts and facts
- Earth science
- Water cycle unpacked
Outcome
By understanding and modeling how the different materials and systems in our world interact we can better predict and manage our environments to our safety, survival, and aesthetic enjoyment.
Science concepts: physical, earth, life
Big ideas:
Watersheds, streams and rivers are created as water flows down a slope and gathers in channels. These channels are formed by the interaction of the flow down a slope, the volume of water, and the erosion ability of the earth materials through which they flow across time.
Related concepts
- The volume of water effects the size and shape of a stream.
- The slope of a stream effects the size and shape of the stream.
- The kind, size, and shape of earth material effects erosion.
- Water flow causes sand to be picked up.
- Water flow causes sand to be picked up and moved.
- Water flow causes sand to be dropped.
- Fine sand is moved more easily than coarse sand by streams.
- Deposits are formed as a result of the streams flow.
- Erosion is the movement of soil and rocks from one place to another due to water, wind, and gravit to another place.
- Erosion and deposition occur in different places in a curving stream.
- Some streams flow straight and others make loops and curves.
- The movement of sand is affected by the angle of the channel, the number of channels, and the location of the channels.
- Different kinds of objects speed up or slow down the movement of sand.
- Flood is an overflowing of a large amount of water beyond the channel in which it is normally confined. Especially onto land where it normally does not flow.
- Floods can kill people and animals and destroy homes, businesses, and farmland.
- Flash flood is a flood that happens very fast often without warning because of a huge rainfall.
- Mega floods occur in places where there have been large floods before or in places with water sheds similar to where previous megafloods have occured.
- Sediment is soil particless, sand, and minerals moved by water and wind.
- Mitigation strategies are used to lessen the effect of flooding.
- Seasonally frozen ground has an important influence on river dynamics because ice located in the pore spaces between sediments increases mechanical strength, acting as glue to hold riverbanks together. Source See Haughton River meander
- Factors controlling the migration rate response depend on whether thawing of floodplain materials, such as sand, silt, clay, and gravel, or river-ice breakup intensity governs local erosion processes. Yet apart from a recent Alaskan study, direct links between air temperature and river adjustments, such as lateral migration rates or abrupt channel switching, remain unclear. Source
Outcome
- Describe the relationships of water flow through watersheds on erosion, channeling, and floods. Describe how earth materials and its surface interact with the flow of water and how volume and speed of flow effect the size, shape, and flow of streams and rivers.
Specific outcomes
- Describe greater volume will create larger channels and faster flow.
- Describe rain and run-off as a powerful force that erodes the Earth.
- Describe how different flows of water interact with the Earth to create stream beds.
- Describe how different flow volume relate to precipitation and run-off.
- Describe how speed of the flow relates to the slope, run-off and shape of the channel.
- Describe how different earth materials effect the flow of the water by mass, hardness, shape, and location of materials.
- Describe how different channels and deposits are created. See research on erosion and accretion 2025
- Describe floods as an overflowing of a large amount of water beyond the channel in which it is normally confined. Especially onto land where it normally does not flow.
Inquiry, process, & cross cutting concepts & skills
Inquiry (How science inquires for understanding: process, skill, methodology, practice)
When I experiment I collect observations that describe how different properties change (become variables) when objects and systems interact. This helps me make claims to explain what is happening, and make models to predict what might happen in the future.
Related concepts and facts
- Observed changes can be described as changes of properties (variables).
- Variables are observations of a property that changes - size, shape, temperature, amount, volume, rate, ...
- When people disagree on an observation, they usually make more and better observations.
- Observation, creativity, and logical argument are used to explain how variable changes effect resulting observations.
- Observed changes can be explained as being caused by changes of variables (changes of properties/ characteristics).
- Explanations are based on observations.
- Evidence is observation.
- Inference is an explanation based on observation.
- When people disagree on explanations, they can make more observations or change their explanation.
Outcome
Describe change as a result of interactions. Describe those interactions as changes of a characteristic/ property (variable) that interacts with the object that changes.
Specific outcomes -
- Describe changes as a result of interactions (water interacts with earth materials to erode and create channeling).
- Describe interactions as changes of a characteristic/ property (variables) [(erosion, channeling, ...)] that interacts with the force of water created by [(slope, volume, ...)] that changes [(change the Earth)].
Cross cutting
Systems, Order, & Organization; Evidence, Models, and Explanations; Constancy, Change, and Measurement; Evolution and Equilibrium; Form and Function
See more processes concepts & misconceptions
Related concepts and facts
- Observational data and reasoning is used to explain interactions. Evidence is something that
is observed and can be used to understand what is happening and make predictions
about future changes.
- Explanations are based on observation derived from experience or experimentation and are understandable.
- Pictures or symbols can represent objects.
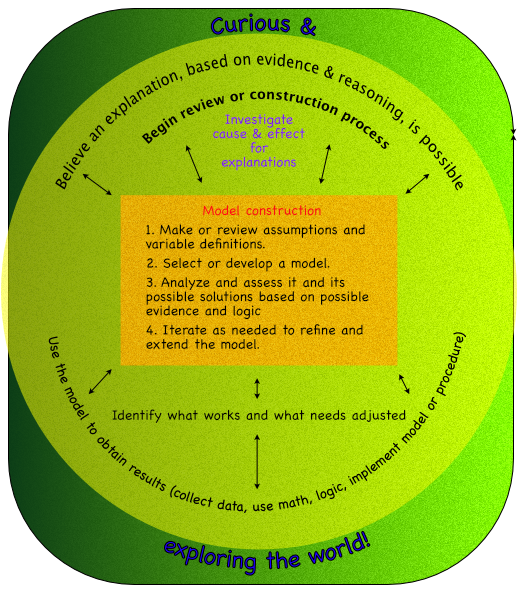
- Models are structures that correspond to real objects, events, or classes of events that have explanatory and predictive power (physical objects, plans, mental constructs, mathematical equations, computer simulations...) that may or may not be observed with real objects, systems, and events.
- Model is an explanation based on observations, facts, laws, inferences, thought, and reasoning.
- Models represent systems or things used as an example to follow or imitate to provide an explanation.
- Models can be used to think about events or processes that happen very slow, fast, or on a too small or large scale to change easily or safely.
- Mathematical models can be displayed on computers and changed to see what happens.
- Models are used to represent things in all dimensions of science physical, earth, and life science.
- Models are created with similar processes, which can be an algorithm or procedure. Such as in the diagram.
- A model, though different from the real thing, can be used to learn something about the real thing.
- Seeing how a model changes may suggest how the real thing works if the same were done to it.
- Models make predictions.
- More than one model can represent the same thing or event.
- The kind of model and its complexity depend on the purpose of using the model.
- Models are never exact representations.
- A model that is too limited or complicated may not be useful.
- A model represents entities and the relationships between them.
- There are two basic types of models, physical and conceptual. Conceptual communicate through words and drawings, or can be physical and demonstrable.
- Models help generate ideas, solve problems, make predictions, help think.
- Models can be used to represent new ideas and inventions.
- Engineers use models to create designs to change the shape of the land and design structures to prevent and withstand floods.
Outcome -
- Make observations of change, identify variables associated with the change, and create explanations of how the variables effect those changes.
- Create models to explain and predict stream flow, channeling, and flooding.
- Engineer designs that change the shape of the land or add structures toprevent and reduce flooding.
Specific outcomes -
- Identify variables related to a change (volume, slope,properties of earth materials).
- Relate variables to change with an explanation.
- Erosion and channeling are evidence that can be used to explain (infer) the history of the water's interactions with the environment over time and used to predict the future.
Perspectives
Engineering & Technology
- Stream tables are used to model river and stream channels to protect from floods, manage transportation, provide habit, recreations, and aesthetic environments.
- People have always had problems and invented tools and techniques (ways of doing something) for scientific inquiry and technological design.
- The two have similarities and differences.
- Scientists propose explanations for questions about the natural world, and engineers propose solutions relating to human problems, needs, and aspirations.
- Technologies exist within nature and so they cannot contravene physical or biological principles. Technological solutions and technologies they have side effects, costs, carry risks, and provide benefits.
- Many different people in different cultures have made and continue to make contributions to science and technology.
- Technology is essential to science, because it provides instruments and techniques that enable observations of objects and phenomena that are other wise unobservable due to factors such as quantity, distance, location, size, and speed.
- Technology provides tools for investigations, inquiry, and analysis.
- Science and technology are reciprocal.
- Science helps drive technology, as it addresses questions that demand more sophisticated instruments and provides ideas for better instrumentation and technique. Technological designs have constraints that engineers, architects, and others must take into account to solve practical problems.
- Some constraints are unavoidable, for example, properties of materials, or effects of weather and friction; other constraints limit choices in the design, for example, environmental protection, human safety, and aesthetics.
- The knowledge base for science is recorded in print and electronic media and can be found and understood by people in and out of classrooms
Personal and Social Science
- Describe how watersheds are both important for our survival and harmful and by understanding them we can increase the benefits they provide and decrease their potential harm.
- The application and the use of models in science and technology can and will benefit society.
- Model helps me internalizing or abstracting understanding.
Nature of Science
- Science can provide ideas for our protection and desire for a better life.
- Scientists use models.
History of science
See also Concepts & misconceptions also science, math, technology timeline
- People have practiced science and technology for a long time.
- Science develops over time.
- Science investigators such as
Outcomes
Describe how humans work together to use science to explain the world with models and use them to engineer designs to change the shape of the land and design structures to prevent and withstand natural events, such as floods.
Attitudes, values, & disposition for scientific habits of mind
- I can learn about the world around me by asking questions, making careful observations, and trying things.
- I can remember and understand better if I record information by writing, drawing, or using technology to record information.
- I need to be skeptical, because different explanations can be given for the same information and sometimes you can't tell which is better.
- It's fun to share what you know with other people.
- It's okay for people to have different ideas.
- I learn from others when I keep an open mind and listen to others ideas.
- Experiments that do not turn out the way that was predicted can still provide useful information.
- Investigation is an adventure that has been enjoyed by people everywhere and for all time.
Scoring guide -
Top level
- Describes rain and run-off is a powerful force that erodes the Earth and how different flows of water interact with the Earth to create stream beds. How different interactions depending on flow volume (related to precipitation and run-off), speed of the flow (related to the slope, run-off and shape of the channel), and earth materials (related to the flow of the water, mass, hardness, shape, and location of materials) create different channels and deposits.
- Describes rain and run-off as a powerful force proportional to the slope or volume of the flow. That water flow erodes the Earth in specific ways to create channels. And even thought large volumes of water or steep slopes can increase erosion long periods of time can erode the most erosion tolerant earth materials.
- Describes rain and run-off as causing erosion and water from it as collecting in streams and rivers and emptying into seas and oceans.
- Describes rain as related to streams and rivers and streams and rivers as concluding where seas and oceans begin.
Low level
Scoring guide structure & function
Top level
- Explains how the major design decisions (structures) impacts the flooding of the land as variables of slope, volume, erosion, earth materials, and plants (functions). Explaining how major design decisions (on buildings, geography, plants, and building materials) impacted the effects as variables.
Analyzes the strengths and weakness of the design for ways to improve on them. Includes causes such as these. - States several design (structures) changes and what each one effected (function). Doesn't describe how the effect varied.
States the strengths, as what worked, or weakness, as what didn't work, assuming based on the design. - Describes design changes and differences without connecting them (as a function related to a structure).
No analysis.
Low level
Strategies and activities to achieve intended learnings
Pedagogical ideas
Based on learning cycle theory & method
Possible Activity Sequence
- Focus student's attention and collect diagnostic assessment information by asking and letting students discuss the focus questions.
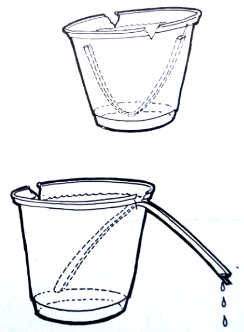
- Demonstrate how to set up a syphon with the materials which will be used.
- Students practice making streams.
- Experiment and create streams with different shapes and volume.
- Experiment with streams flow rates, slopes.
- Begin experimenting with streams in beds (add course gravel) for flow rate and volume
- Controlled experiment to test hypotheses about speed and volume.
- Streams Erosion, Transportation, and Deposition
- Design a model for fluvial: fluvial, alluvial and deltaic deposits.
- Erosion, deposition, and meandering streams (shapes of streams)
- Expansions activities -
- Flood - zoo flood challenge, animals, in flood, how would you protect them? Alter landscape, flood again. Do outdoors, make an outdoor model zoo, use toy zoo animals, mention storm coming, predict, alter with materials, alter ground around the zoo, flood again.
- Draw before and after pictures of your first design and label materials used.
- Why did your group design this solution?
- Draw a picture of your second design.
- Why did your group change the land and design this solution?
- Which designs made the biggest impact on moving the flood water away from the zoo?
Materials
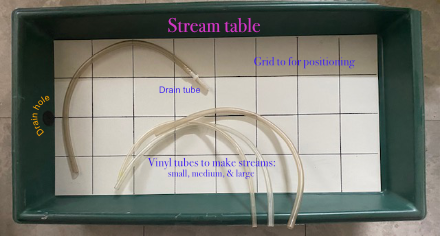
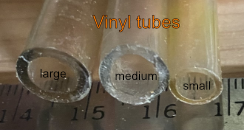
- Stream-table setup: plastic siphon tubes of different diameters (4mm, 5mm, 6mm), reservoir container, catch container, plastic drain tube,
- 300 ml coarse sand
- 300 ml of fine sand
- Sheet of stiff plastic
- Ruler
- Pencil, colored pencils, brown, blue, black, green,
- Paper
- 600 ml mixed sand (coarse and fine-sand)
- Large stone
- 600 ml of soil
- Grass seeds
Focus questions:
- What is water?
- How does water interact with the Earth?
- How does water shape the Earth and geography of the Earth?
- What are the forces that cause the shaping?
- How can you collect data to model the flow of water from falling as precipitation and its travel to the ocean.
- What is a flood?
- What causes a flood?
Additional resources
- Watershed exploration with the WikiWatershed Toolkit & to model your watersheds. A tool kit to map your geographical region and provide watershed information.
- Excellent research article on avulsions: how they form, evolve, and stream table models used to model their behaviors. When the Levees Break by Fred Pearce in Science May 14, 2021.
- Excellent research article on historical avulsions around the world. Where Rivers Jump Course by Sam Brooke et. al. in Science May 27, 2022.
Activities
Lesson plans
Lesson plans for each of the activities are not included. Recommendation for them would be to follow a learning cycle (exploration, invention, discovery) for each activity. The lab notes can be used to generate a plan for each activity chosen for students to participate in.
Example:
Exploration: The investigation questions in the lab notes can be asked and discussed. Discuss what the students know about the question and how information can be collected with an investigation to provide information for students to validate their ideas and create explanations and models. The materials, set up, and procedures in the lab notes can be used to provide guidance and suggestions for the invention. When students have different ideas, then the students ideas should be replace for their procedures.
Invention: The investigations are implemented, students collect information from their investigation, share the results with the class, discuss differences, and explain how their observations can be used to answer their investigation questions and make decisions on how to further investigate.
Discovery: Review, summarize, and discuss what was found and how it can or can't be generalized to streams, rivers, and watershed on Earth and other planets and what might be further explored. Often, a follow-up investigation can be considered as moving to the next activity in the Lab notes.
Lab Notes
Lab note 1 - Characteristics of water flow
Streams shape, volume, and slope
Investigation question
How can different streams be modeled and mapped?
Materials
- Stream-table setup: plastic siphon tubes of different diameters (4mm, 5mm, 6mm), reservoir container (liter container) , catch container (5 gallon bucket), plastic drain tube,
- Ruler
- Pencil
- Paper
Set up and creating streams
- Set up the stream table with one end raised 12 centimeters higher than the other
- Practice making a syphon and starting and stopping the flow.
- When you can control the flow continue.
- Make a stream and watch the way it flows.
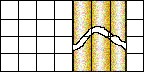
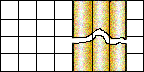
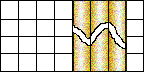
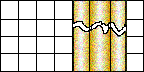
- The grid on the stream table should help you see if the stream goes straight or changes direction.
- Let all the water flow from the reservoir.
- Refill the reservoir and make another steam.
- Does it look like the first one?
- Make more streams to see if they are like the first two.
- Does each stream look a little different?
What similarities were there?
Draw one of your streams.

Which one of these is closest to your drawing?

Explain.
Lab note 2 - Steams with different shapes & volumes
Investigation question
How can different volumes of water in a stream be modeled?
How does the volume of water affect the size and shape of a stream?
Materials
- Stream-table setup: plastic siphon tubes of different diameters (4mm, 5mm, 6mm), reservoir container, catch container, plastic drain tube,
- Ruler
- Pencil
- Paper
Set-up
- Try a different sized plastic tube and see if different sizes of plastic tubes make different kinds of streams?
- Is the stream different from the first one that you made?
- To be convinced that there is a difference try each of the three sizes several times.
- Make two or three streams with each of the different sized plastic tubes.
- Draw a map for the streams.
- Record the plastic tubes size next to your map.
Tube size ...... Slope ......
Tube size ...... Slope ......
Tube size ...... Slope ......
Tube size ...... Slope ......
Tube size ...... Slope ......
Tube size ...... Slope ......
Summary
Which tube made the widest stream?
The narrowest stream?
How does the size of the plastic tube affect the size and shape of the stream?
How does it effect the volume of the stream?
Lab note 3 - Streams with different flow rate, slopes
Investigation questions
How can different slopes of streams be modeled?
How does the slope of a stream affect the size and shape of the stream?
Materials
- Stream-table setup: plastic siphon tubes of different diameters (4mm, 5mm, 6mm), reservoir container, catch container, plastic drain tube,
- Ruler
- Pencil
- Paper
Set-up
- Lower the raised end of your stream table about three centimeters to make the slope less steep.
- Make a stream.
- Make more streams until you are satisfied as to the kind of stream that will form.
- Draw a map of your stream.
- Record the size of the plastic tube and the height of the end of the slope.
Tube size ...... Slope ......
Tube size ...... Slope ......
Tube size ...... Slope ......
- Lower the elevated end of your stream table about three centimeters. This will decrease the slope more.
- Make a stream.
- Make more streams until you are satisfied as to the kind of stream that will form.
- Draw a picture of your stream.
- Record the size of the plastic tube and the height of the end of the slope.
Tube size ...... Slope ......
Tube size ...... Slope ......
Tube size ...... Slope ......
Summary
When you have some good ideas about how the slope and different sizes of plastic tubes affect the stream, then answer these two questions:
How do the different sizes of plastic tubes affect the size and shape of the stream?
How does the slope affect the size and the shape of the stream?
Lab note 4 - Moving the streams into a bed
Volume and Speed in a Stream bed
Investigation questions
How does volume and speed affect a real stream?
Materials
- Stream-table setup: plastic siphon tubes of different diameters (4mm, 5mm, 6mm), reservoir container, catch container, plastic drain tube
- 300 ml coarse sand
- Ruler
- Pencils - blue and brown or black
- Paper
Set-up
Usually streams flow over dirt, rocks, sand, stones, and mud.
We can add sand to model these and see.
Making a dam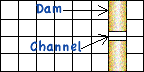
- Dampen the coarse sand with a little water.
- Carefully pour the sand onto the upper end of the stream table.
- Then spread the sand out between the lines on the table as shown in the picture.
- Make sure the sand is as flat as possible.
- Now make a channel in the dam.
- The channel should be about 2 centimeters wide.
- Again, flatten the sand.
- Slope the stream table so the top end is 12 centimeters high.
- Use the large plastic tube to start a stream flowing.
- Observe where the water flows.
- Draw a map of your stream.
Draw on the paper grid where the water flows with a colored pencil.
Show where the sand is with another colored pencil.
Color the map dark where the sand is thick and light where it is thin.
A little hill might look like this:
Next to your map, be sure to record the height of the end of the slope and the diameter of the plastic tube you used.
Your map might look something like this:
 Tube size 6mm Slope 12 cm
Begin by seeing how the volume of water affects the stream. Start with the large tube, make a dam, a two cm channel, and see what happens.
Tube size 6mm Slope 12 cm
Based on your observation what kind of stream would you predict a smaller plastic tube will make.
Will it wash away less sand?
Check it out.
Mix the sand.
Rebuild the dam.
Use a plastic tube with a smaller diameter.
Tube size ...... Slope 12 cm
Can you find a way to have less sand wash away when you use the large (6-mm) plastic tube?
Try out your idea.
Again, mix all the sand together and rebuild the dam as before.
Tube size ...... Slope ......
Summary
Was there a difference?
What was the difference?
What did you discover?
Lab note 5 - No erosion?
The amount of sand erosion is reduced if the slope is lower or the volume of the stream is smaller. What would happen if both variables were reduced so the tube size is 4mm and the slope is 0?
Draw a map to show what you think would happen.
Tube size 4 mm Slope 0 cm
Mix the sand and make a new dam with a two centimeter channel. Refill the reservoir and test your prediction.
Was your prediction correct?
It's hard to tell exactly where the sand is going to move, isn't it?
Draw a map to show where the sand actually moved.
Tube size 4 mm Slope 0 cm
Summary
When you tried to reduce the amount of sand moved by water, did you make the water move faster or slower?
Describe how the speed of the water affects the movement of sand.
Describe how the volume of the water affects the movement of sand.
Write statements about how the speed and volume of water affects the movement of sand. If you described how one variable effected another variable, then that is a hypothesis.
Lab note 6 - Volume & Speed in a Stream
Investigation question
Can an experiment be created to support or reject the hypotheses about speed and volume described in the previous investigation?
How does water flow, volume and speed, affect sand in a stream?
Materials
- Stream-table setup: plastic siphon tubes of different diameters (4mm, 5mm, 6mm), reservoir container, catch container, plastic drain tube
- 300 ml coarse sand
- Ruler
- Pencils - blue and brown or black
- Paper
Set-up
| Setup | Plastic tube diameter | Slope |
|---|---|---|
| 1 | large 6 mm | 0 cm |
| 2 | small 4 mm | 0 cm |
| 3 | large 6 mm | 9 cm |
| 4 | small 4 mm | 9 cm |
Use the information in the chart to set-up some models and conduct a controlled experiment to answer this two part question: How does volume and speed effect the flow of a stream?
- Mix the sand and make a new dam with a channel about seven centimeters wide.
- Make streams flow using the four different setups, one at a time.
- Remix and form the sand between each trial.
- Draw a map for each.
- Record the setup data for each map.
- Your maps should show any differences you observed.
Tube size 6 mm Slope 0 cm
Tube size 4 mm Slope 0 cm
Tube size 6 mm Slope 9 cm
Tube size 4 mm Slope 9 cm
Summary
Use the evidence recorded on the maps.
Were your ideas supported?
List observations that support your hypothesis; or write a new hypothesis that is supported by your observations.
Lab note 7 - Streams Erosion, Transportation, & Deposition
Investigation question
How does water pick up, move, and drop sand in a stream?
Materials
- Stream-table setup: plastic siphon tubes of different diameters (4mm, 5mm, 6mm), reservoir container, catch container, plastic drain tube
- 300 ml coarse sand
- Ruler
- Pencils - blue and brown or black
- Paper
Helpful Vocabulary
- Erosion is the washing away of the sand.
- Transportation is the movement of materials by water.
- Deposition is the dropping of materials from a stream.
Set-up
Make a new dam. It doesn't matter what kind of dam you make, but try to make the very slowest stream you can. Once the stream starts flowing try to keep it going. When the water in the reservoir is almost gone, scoop some more from the catch pail and refill the reservoir.
Watch the dam carefully as it erodes, or wears away.
Here are three sets of questions to help answer the investigation question as you observe the sand being eroded, transported, and deposited.
Set 1
- What size particles move first?
- Do particles on the top or bottom move first?
- What happens to the corners of the dam?
- What shape does the dam become?
Set 2
- Look for a place where sand is being transported. Observe it carefully.
- Does the sand move in a steady stream?
- Watch just one piece of sand as it moves down the steam. How does it move?
- Does the sand affect the water flow?
Set 3
- Watch a place where sand is being deposited.
- Are all the particles of sand dropped at the same place?
- Does sand affect the water flow?
- Find two or three places where sand is being deposited. Can you tell why this is happening?
- Put your finger in the stream where sand is being transported. What happens to the water?
- What happened to the sand?
On what did set 1 focus observation?
On what did set 2 focus observation?
On what did set 3 focus observation?
Now make a faster flowing stream.
Observe erosion, transportation, and deposition.
Summary
Draw a picture to show and words to describe how does water picks up, moves, and drop sand in a stream?:
Water flow causes sand to be picked up ...
Water flow causes sand to be moved ...
Water flow causes sand to be dropped ...
Lab note 8 - Movements of sand, erosion, & deposits
Investigation questions
- How does size of particles effect movement?
- How are deposits formed from stream flow?
- How did Leonardo draw the motion of water around a pier? See his diagram of eddies
Materials
- Stream-table setup: plastic siphon tubes of different diameters (4mm, 5mm, 6mm), reservoir container, catch container, plastic drain tube
- 300 ml of fine sand
- Sheet of stiff plastic
- Ruler
- Pencils - blue and brown or black
- Paper
Set-up
In this activity you will work with fine sand.
- Remove all the coarse sand from the stream table.
- Pour fine sand onto the stream table, moisten it, and make a dam.
- Choose one of your maps you made when you used coarse sand in activity 2.
- Using the fine sand, make the same setup.
- Then make a stream.
- Observe the flowing water.
- Then draw a map.
- Show the water and sand patterns on your map.
- Record the plastic tube size and the height of the stream table.
Tube size ...... Slope ......
Which best describes what happened?
- More fine sand moved than coarse sand.
- Less fine sand moved than coarse sand.
- The same amount of fine and coarse sand moved.
Select another map from the coarse sand experiments.
- Set up the stream table just as you did for that map. See how good records are helpful?
- Make the water flow.
- Draw a map of the sand and water patterns.
Tube size ...... Slope ......
Compare your map showing fine sand and your map showing coarse sand.
Was more, less, or the same amount of sand moved?
How does the particle size of sand affect the amount of sand moved by a stream?
If you are not sure how the particle size of sand affects its movement, find another map, set up the stream table just as you did for coarse sand, make a stream flow, and collect more information until you are sure.
Set up the stream table so that you will get a medium flow of water. Then, make a dam (it doesn't matter what kind) and start the stream flowing. Let the stream run long enough so that you can see the pattern of deposition. Now stop the stream.
After the water stops flowing, lay the plastic sheet on the stream table about 20 centimeters below the dam. Place a pencil under the bottom of the sheet parallel to the lower edge.
Let the stream flow over the sheet. Observe what happens.
What happened to the speed of the water as it flowed over the plastic sheet?
If you are not sure, put a tiny piece of paper on the water at the top of the stream table. Notice if the paper changes speed as it moves down the stream.
Do you think that changing the speed of the water might cause deposition?
Write an explanation for your idea.
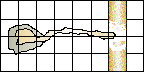
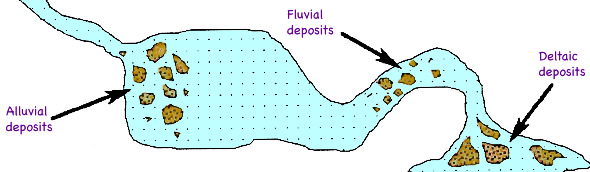
When a stream drops material it is carrying, the deposit is called a fluvial (flu've-al) deposit. Sometimes the stream drops some of its load just after it passes through the dam.
Another kind of fluvial deposit is called an alluvial ( a-lu've-al) deposit. It generally occurs where a stream widens as it leaves a valley.
When the stream hits the pond, almost all of its load is dropped. This is called a deltaic (del-ta'ik) deposit. This kind of deposit occurs when a stream enters a pond, lake, bay, or ocean.
When the stream changes speed, as it flows over a plastic sheet, deposits are left along the stream bed. These are also fluvial deposits. They occur as a stream changes speed or direction along its course.
Summary
Use your explanation to explain all three types of deposits.
Putting your ideas to the test
Design a model that will make as much alluvial deposit with as little deltaic deposit and other fluvial deposits as possible.
Arrange your stream table any way you wish and try different combinations until you find one that makes large alluvial deposits.
Map your model, describe the method for forming the deposits, and explain what is happening to create a large alluvial deposit.
Alluvial deposits
Tube size ...... Slope ......
Notes:
Design a model that will make as many fluvial deposits as you can with very little or no alluvial or deltaic deposits.
Try making channels of different widths, changing the height of the end of the stream table, and using plastic tubes of different widths. When you are sure that you have found the best way for making the deposits, map your model, describe the method for forming the deposits, and explain what is happening to create a large alluvial deposit.
Need a hint: use your explanation for how changing water speed affects alluvial and fluvial deposition.
Fluvial deposits
Tube size ...... Slope ......
Make two deltas that are very different. Map and explain each.
Delta 1
Tube size ...... Slope ......
Delta 2
Tube size ...... Slope ......
Summary
Not all rivers have deltas, there are many reasons why this is so. Try to think of as many as you can.
Describe how different sizes of sand are moved in streams.
Describe how different sizes of sand are deposited in streams.
Optional activity
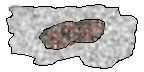
Have you noticed black particles in the sand?
Make another dam, it doesn't matter what kind. Then make a stream that flows very slowly. Watch the movement of the black sand. Where is it deposited?
Why do you think the black particles are separated from the light-colored ones?
Most of the light-colored sand is quartz. What are the black particles?
Where could you find more information about sand?
Lab note 9 - Erosion deposition & meandering streams
Investigation questions
Why do streams curve in different places?
What makes the difference if a stream flows straight or makes loops and curves?
Materials
- Stream-table setup
- Plastic tubes of different diameters (4-mm, 5-mm, and 6-mm)
- Metric ruler
- Colored pencils
- 600 ml mixed sand (coarse and fine-sand)
Set-up
- Remove all the sand in the stream table.
- Replace it with twice as much mixed sand, 600 milliliters, and make a dam.
- Dampen the sand with a little water.
- Pour the mixed sand onto the stream table.
- Make a wide dam,.
- Use your finger or a pencil to make a big C channel in the sand.
Let the stream flow down the table and observe what happens in the channel.
Map what happened to the sand. Be sure to write the size of the plastic tube and the height of the end of the slope.
Tube size ...... Slope ......
Mix the sand and make another C channel. This time adjust the end of the slope so the water will flow faster. Observe the pattern of erosion and deposition along the channel. Map the pattern.
Tube size ...... Slope ......
Make one more C channel, but this time make the water flow very slowly. As it flows, look for erosion and deposition along the channel.
Usually erosion and deposition occur at different places along a curved channel. As you keep the water flowing slowly, watch the inside and the outside edges of the curve.
Where does erosion occur?
Draw a map of the channel. Mark an "X" wherever the sand eroded and show depositions in a dark color.
Tube size ...... Slope ......
Now make a smaller "C" channel like this:
Let a very slow stream flow through it. Does erosion and deposition occur at the same places as for the larger C channel?
Do you think that erosion generally occurs at the same place along a curved channel?
Map and mark X's wherever you think erosion occurs.
Tube size ...... Slope ......
What happens to a C channel in a faster stream?
Both the C diagram and your written explanation might be a hypothesis if you described how the change in one variable will change another variable.
You can test your hypothesis with an even smaller C channel. Try one like this:

Use a very slow stream for your test.
How do you think the channel will erode when you start the water flowing? Show your prediction by making a map.
Tube size ...... Slope ......
Start the water flowing and look for places where erosion occurs. Draw them and describe which of your explanations was supported.
Tube size ...... Slope ......
You can also test your hypothesis with S curves. Mix the sand and make an S channel like this:
What will happen to the channel if the stream is very fast? Try it and see. Is one of your hypothesis supported?
What do you think will happen as a very slow stream moves through an S channel? Draw a map to show your prediction.
Tube size ...... Slope ......
Mix the sand and make the channel. Set up the stream table for a slow stream, and let it flow. Draw a map to show what happens. Next to your map, explain what is happening by describing how one variable change causes another variable to change (hypothesis) and describe observations to support it.
Tube size ...... Slope ......
Brain Busters:
Try to make a stream that will flow in "S"-shaped channels.
Here are some to try:

You can think of many more. Try them and make a drawing of those that work and explain why.
Tube size ...... Slope ......
Tube size ...... Slope ......
Can you make a channel so that water will flow uphill, even for a very short distance?
You have discovered what S channels become if the water flows very fast.
Can you get an S or C channel to form all by itself?
If not try some more experiments.
Summary
Describe how erosion and deposition occur in different places in a curving stream.
Describe why some streams flow straight and others make loops and curves.
lab note 10 - Expansion Activities:
Investigation questions
How does the movement of sand change the angle of the channel, the number of channels, and the location of the channels?
How do different kinds of objects speed up or slow down the movement of sand?
Materials
- Stream-table setup
- Plastic tubes of different diameters (4-mm, 5-mm, and 6-mm)
- Metric ruler
- Colored pencils
- 600 ml mixed sand (coarse and fine-sand)
- Large stone
- 600 ml of soil
- Grass seeds
Set-up
- Remove all the sand in the stream table.
- Use a mixture of coarse and fine sand on the stream table.
These activities are questions to investigate. To answer each question, you will probably want to make the stream flow at several different speeds. You can make a dam of any width, although the pictures show dams that are 30 centimeters wide.
How does the sand move when you have two channels like this?

What will happen if you have two channels like this?

Or this?

Or this?

What will happen with many channels instead of two?

What about this pattern?

What happens if you put an object in the channel?
How do you think the sand will move?

What would happen if the stone was at another position in the channel?
Tube size ...... Slope ......
What if a pencil were put in the channel (like a tree or beaver dam, or ...) ?
Does the position of the pencil make a difference? How?
Tube size ...... Slope ......
Changing sand and gravel to soil
If you use soil to make a dam do you think you will get the same results?
Remove the sand from the stream table and put in an equal amount of soil.
Repeat some of the tests, with soil instead of sand, that you have just done.
Does the soil interact the same as the sand?
Explain why the soil interacts the way it does?
How would growing seeds in the soil affect the way that the dirt moves?
Grass grows fairly quick so it could be grown or a clump of sod could be used to save time from having to wait for it to grow.
Start with a very slow stream.
Slowly increase the speed of the water.
Do plants affect erosion?
Describe the erosion and channeling.
Tube size ...... Slope ......
Here are some more grids for more experimenting:
Tube size ...... Slope ......
Tube size ...... Slope ......
Tube size ...... Slope ......
Summary
Describe how the movement of sand is affected by the angle of the channels, the number of channels, and the location of the channels.
Describe how different kinds of objects speed up or slow down the movement of sand.
Lab note 11 - Floods & their effects on buildings, channels, & watersheds
Investigation questions
How do floods interact with the land they flow through and buildings?
- What do you know about flood prevention?
- What strategies have you learned that manipulate the flow of streams?
- How does the shape of the land affect flooding?
- What structures can control or prevent floods?
- What happens when the flow or volume of water increases?
- Why is it important to control or prevent flooding?
Materials
- Stream-table setup
- Plastic tubes of different diameters (4-mm, 5-mm, and 6-mm)
- Metric ruler
- Colored pencils
- Mixed sand (coarse and fine-sand)
- Dirt
- Grass
- Materials to make buildings (wood craft sticks, legos, cardboard, plastic, ... )
Set-up
- Review design process
- Consider two kinds of flood control.
- Placing buildings on higher ground and design ways to divert water from the buildings.
- Design buildings so they are waterproof.
- Decide what mixture of dirt, rock, gravel, sand, clay to use to create the land in your watershed that a stream will flow through.
- Decide on what kind of stream to create (size, slope, shape of the channel, and flow amount) that will flow through your watershed.
- Decide what contour to use for the building area and area around it.
- Decide on plant life.
- Decide what materials to use to build the buildings in the watershed.
Describe the materials used to create your building.
Before
Draw and describe the watershed. The stream, land around it, and building plots.
Volume of water flow before flood ...... Slope ......
Draw the placement of buildings
Describe the flood abatement you planned.
Housing plan (water proof materials, water absorbent materials, foundation, anchoring, )
Land (flood walls, trenches, contour of land, slope, vegetation, levies, flood plane, flood wall, stilts, flood gate, canal, )
During
Decide how to simulate a flood. If use the small tube to simulate the average flow of the stream, then might use two large tubes to simulate a flood. Also consider how long the flow will last, which will represent the total flow over time or during the flood.
After
- Draw and describe the watershed and what happened when the flood started (increase of water flow / volume)?
- What areas flooded?
- Describe any patterns of what happened?
Volume of water flow from the flood ...... Slope ......
Draw the placement of buildings
Describe the condition of the buildings.
Summary
Describe what you learned about watersheds, streams, and flooding. How flooding, erosion, and deposition occur in the stream during the flood and how it interacted with the buildings.
What did you learn about controlling flooding?
Describe what you learned about engineering and design.
What is engineering?
What kind of engineer deals with watersheds, streams, rivers, and flooding?
What is a design process?
What materials can help prevent flooding?
What do you know about flooding in your area?
What prevention model would be good for your area?
What engineers are responsible for making decisions about watersheds and or flooding in your area?
Lab note 12 - Zoo and flooding
Materials
Zoo animals, area outside, or stream table, earth materials, water,
Read over these idea and plan your investigation.
Challenge
Zoo flood challenge
Possible procedure
- Decide where and how to make a model of a zoo. Outdoors - indoors?
- Decide materials. Toy zoo animals, and ...
- Make a model zoo.
- A storm is coming,
- What would happen to the animals if there was a flood?
- Flood the zoo without thought of flood protection and observe the consequences.
- Consider how would you would protect the animals from a flood?
- Alter landscape, alter ground around the zoo, flood again.
- Draw before and after pictures of the zoo and before the flood and after the flood.
- Draw a picture of your second design.
- Why did your group design this solution?
- Why did your group change the land and design this solution?
- Flood again. Observe.
- Which designs made the biggest impact on moving the flood water away from the zoo?
River & stream picture album
Niobrara River, Nebraska July
Niobrara River Nebraska, July - closer
Niobrara River Nebraska, July - closer yet
Avalanche Creek Montana July
River bend through the mountains 1971
Mulberry Bend, Missouri River - shot in Nebraska south of Vermilion SD
Niagara river 1970
Rocky Mountains river 1973
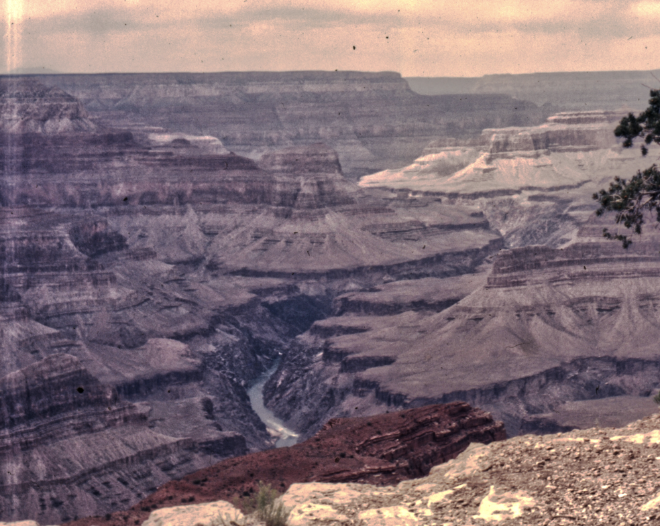
Grand Canyon river valley 1978
River floods
Monongahela River, Pittsburgh, PA 1972 flood
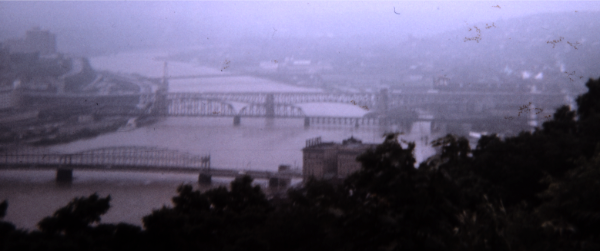
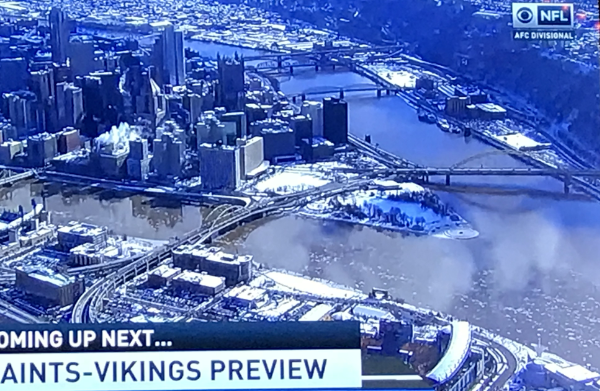
High waters in Pittsburgh where three rivers meet!
Erosion of a pile of dirt after one reain storm!!

Dry Platte River 2023

Haughton River in Devon Island (Tallurutit), Nunavut, Canada
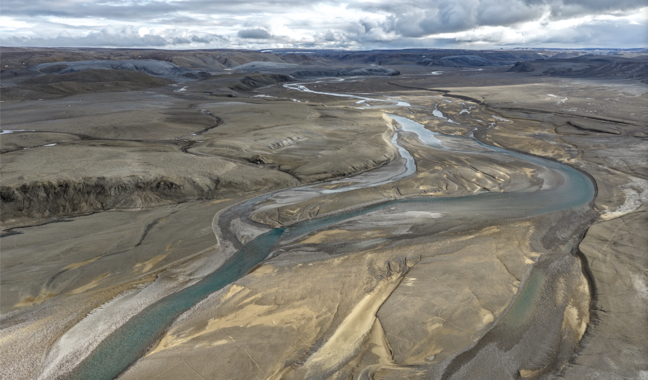
Erosion and meandering accelerated by global warming.
Haughton River in Devon Island (Tallurutit), Nunavut, Canada, exhibits changes in river dynamics amplified by climate warming. Source
Leonardo da Vinci's very detailed drawing of eddies around posts in a stream
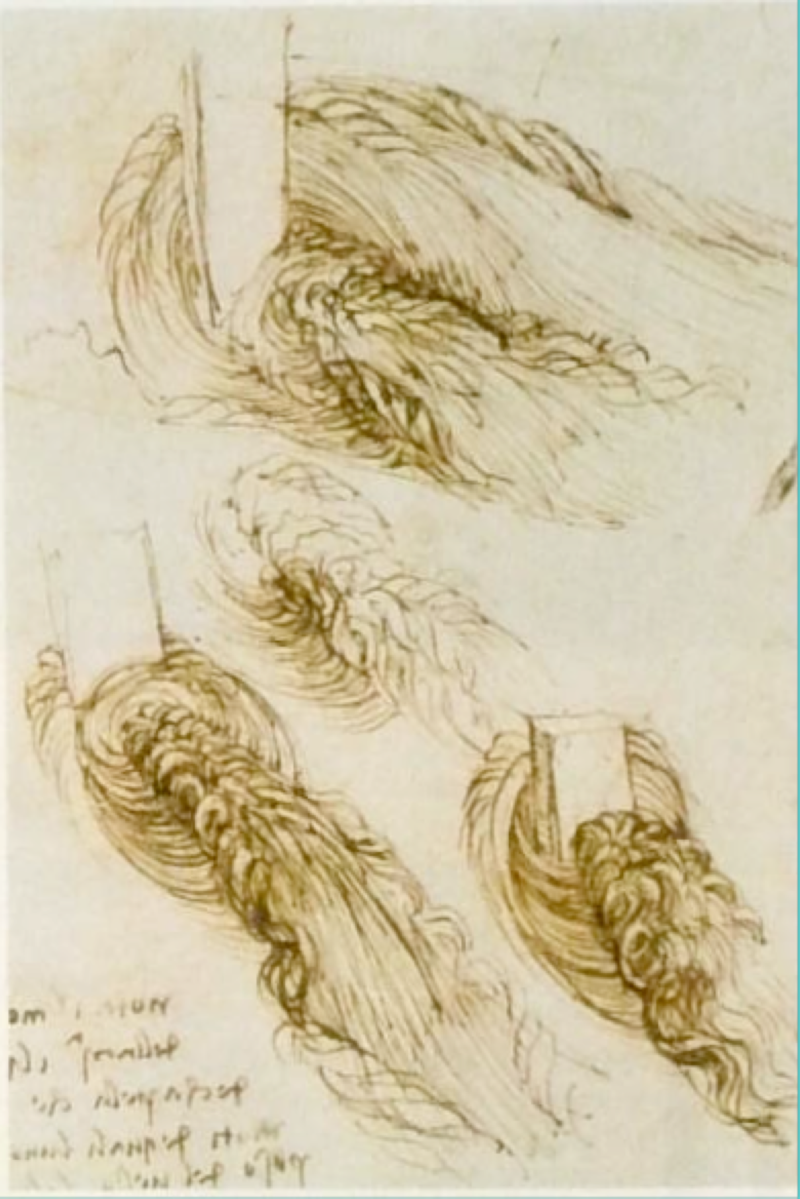
Notice the detail of the water flow that Leonardo has drawn for his study of water motion around a pier over time.
Rui Aleixo modeled flow around a pier like in Leonardo's sketch and claims he was able to see the change in the eddies that were so small that to draw them would be the equivalent of a camera taking video at 100 frames per second. Most humans would perceive them in a range from 30 - 60 frames per second.
Source The Real Da Vinci Code: Scholars on a quixotic quest to identify Leonardo da Vinci's DNA achieve a milestone. Science. January 8, 2026. pp. 118-123.
Expansion Resources
Extension unit
Watersheds & inquiry activities and plan for middle level
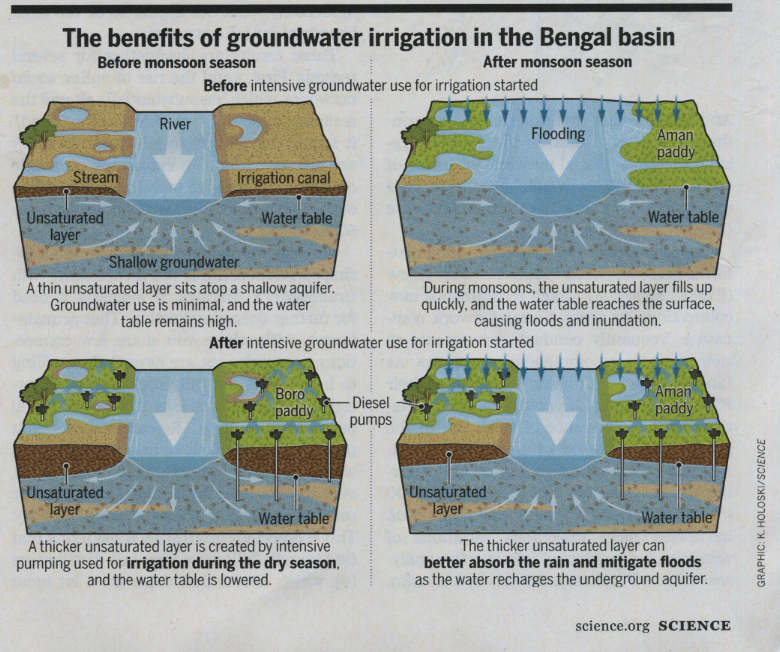
Irrigation & runoff example Bengal, Bangladesh
Irrigation and runoff - A great source with data and model to suggest lower water tables can reduce flooding and improve irrigation management. The Water Machine of Bengal: A data-driven and policy-supported strategic use of aquifers for irrigation is needed to maximize their benefits. Science September 16, 2022.
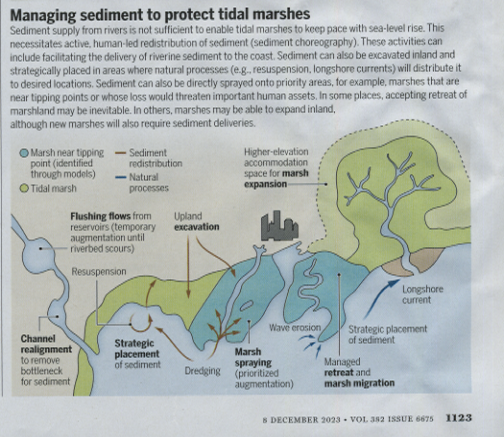
Managing sediment to protect tidal marshes
Single- and multithread rivers originate from (im)balance between lateral erosion and accretion
Summary of single- and multithread channel river beds formation and migration causes by erosion and accretion.
- Multithread channels have multiple threads separated by bars or islands.
- A consistent thread width stabilizes the river channel bed.
- The total channel width remains in equilibrium for single- and multithread cycles.
- Channel patterns depend on lateral erosion and accretion rates.
- Floodplain threads are affected by environmental and human conditions.
- When lateral erosion and accretion balance, threads maintain equilibrium width during migration.
- Large bars split the flow, creating narrower threads.
- New threads widen and split, abandoning some as they become infilled and disconnected.
- Excess eroded bank sediment redeposits locally, forming mid-channel bars.
- If lateral erosion outpaces accretion in multithread channels, threads widen during migration.
- New threads require reduced flow in existing threads, promoting sediment deposition and thread abandonment.
- The imbalance between bank erosion and accretion persists in all multithread channels, including braided, anastomosing, and wandering subtypes.
- Neighboring bends migrate in opposite directions, creating curves and bends as migration exceeds thread width.
- Curve and bend growth leads to intersection and cutoff, removing them from thread segments.
- This cycle sustains a predictable single-thread channel pattern.
- If erosion outpaces accretion, a channel pattern forms through the multithread cycle.
Environmental or human-induced changes can disrupt channel-pattern development by altering lateral erosion and accretion rates. Understanding these changes is crucial for restoring and managing river channels. The text suggests that all multithread channels stem from a common imbalance mechanism, and their diverse morphologies arise from factors like downstream mid-channel bar migration and vegetated island formation.

Single- and multithread rivers originate from (im)balance between lateral erosion and accretion.
by Austin J Chadwick, et al. July 10, 2025
World rivers
Classification of stream and rivers for classification of land use and environmental protection
Three types of stream flows:
- Perennial flow is a stream that has flowing water year-round during a typical year. The water table is located above the streambed for most of the year. Groundwater is the primary source of water for stream flow. Runoff from precipitation is a supplemental source of water for stream flow.
- Intermittent flow is a stream that has flowing water during certain times of the year, when groundwater provides water for stream flow. During dry periods, intermittent streams may not have flowing water. Runoff from precipitation is a supplemental source of water for stream flow.
- Ephemeral flow is a stream that has flowing water only during or for a short duration after precipitation events in a typical year. In many states, this term refers to streambeds that are located above the water table year round and streams where groundwater is not a source of water for the stream.
Collecting data on stream flow in America
Ephemeral streams are river beds which are dry most of the year, but have temporary flows during rainy seasons. They do not have a sustained connection to groundwater. Ephemeral streams typically flow only when rainfall or snowmelt triggers overland and/or shallow subsurface flow that quickly moves toward the channel, moving solutes and particulates along the way as a result, flash floods and higher than usual sediment and pollutants are generated and carried away with ephemeral streams. Yet because these streams are usually dry, they are often excluded from regulatory safeguards and best practices to protect downstream water quality.
Ephemeral streams in the southwest and western United States flow less often, 4 and 46 days per year on average, compared with those in the eastern United States, where ephemeral streams flow on average 173 days per year. Nonetheless, despite their infrequent flow, ephemeral streams in the west contributed a larger proportion of the flow in downstream rivers, often exceeding 75% of the flow in midsize basins, compared with eastern ephemeral streams, which contributed slightly less than 50% of the flow on average to downstream rivers in midsize drainage basins.
Source The Transitory Origins of Rivers: streams that only flow occasionally are major contributors to river flows. By Judson W Harvey & Stephanie K Kampala. Science, June 28, 2024
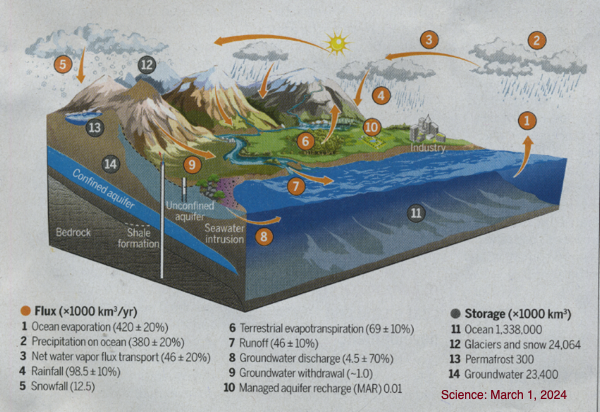
Ground water in a wate cycle
Watersheds in North America

Mississippi River delta evolving

Earth's watershed flows to the oceans

- Science main directory - Investigations & pedagogy
- Science knowledge base